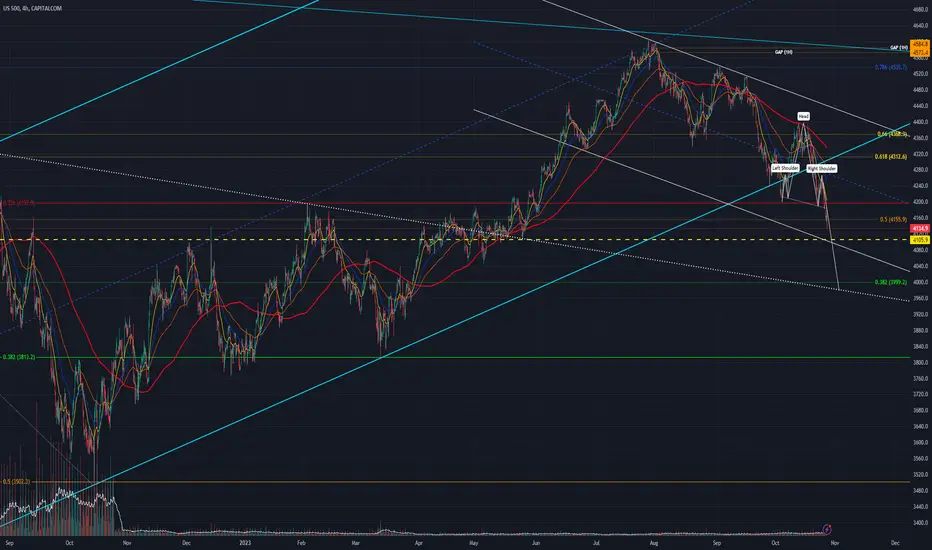
 US500 intraday chart analysis:
4H chart = bearish H&S pattern development + neckline test validation.
Fib retracements:
- Straight line/left labels = March 2020 (Covid) low - Jan 2022 high
- Dotted line/right labels = Jan 2022 high - Oct 2022 low
1st target (yellow dashed):
- ~4100 lower parallel channel & May/June lower-range chop confluence
- Temporary oversold/bounce target? TBC..
2nd target (white dotted):
- ~4000 psych level, H&S extrapolation, 38.2% Fib retrace & declining trend-line (Aug 2022 + Feb 2023 peaks/pivot points)
Bullish reversal target:
- ~4200 (23.6% Fib retrace)
Note
Update 27/10:Interesting price action - buyers stepping in around ~4130 trying to hold 50% Fib retrace.
Temporary support coincides w/ descending trend-line (pivot points @ 18/08 & 04/10 lows).
Prelim trading range:
High ~4184 (break above = bullish reversal / test ~4200 23.6% Fib)
Low ~4127 (break below = bearish continuation / tap ~4100 1st target confluence)

Clause de non-responsabilité
Les informations et publications ne sont pas destinées à être, et ne constituent pas, des conseils ou recommandations financiers, d'investissement, de trading ou autres fournis ou approuvés par TradingView. Pour en savoir plus, consultez les Conditions d'utilisation.
Clause de non-responsabilité
Les informations et publications ne sont pas destinées à être, et ne constituent pas, des conseils ou recommandations financiers, d'investissement, de trading ou autres fournis ou approuvés par TradingView. Pour en savoir plus, consultez les Conditions d'utilisation.