

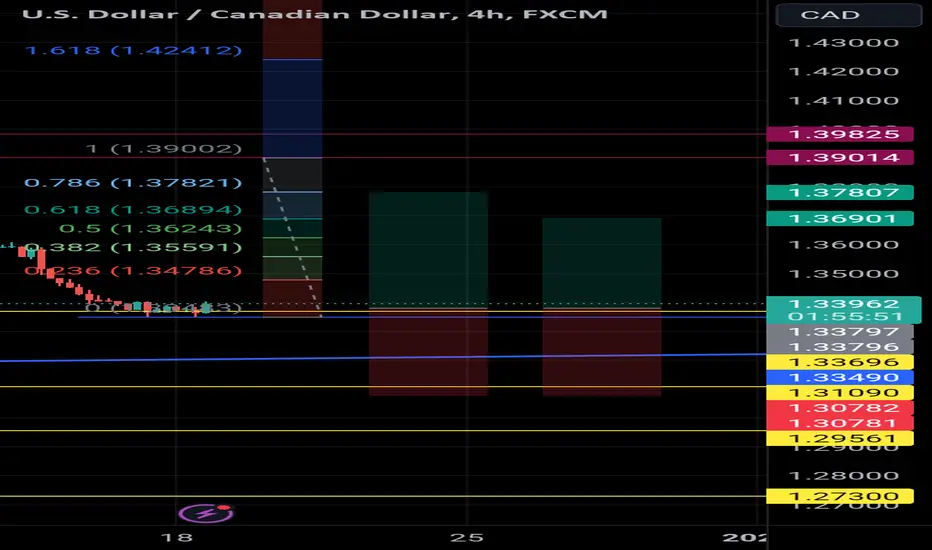
A #long trade opportunity recently presented itself on the #dollarloonie (#USDCAD) #trading chart 📈.
This is indicated by the #bullish harami candlestick 🕯️ pattern on the 1.33696 horizontal support level.
This indicates a fakeout of the same level, with potential price move in the upward 👆 ⬆️ direction (#buy).
Sufficient upward momentum should see price rallying towards the 1.38000 psychological level and possibly testing the strength of the 1.39014 horizontal resistance level.
As always, please apply appropriate risk management.
Happy trading!
#majorpair
This is indicated by the #bullish harami candlestick 🕯️ pattern on the 1.33696 horizontal support level.
This indicates a fakeout of the same level, with potential price move in the upward 👆 ⬆️ direction (#buy).
Sufficient upward momentum should see price rallying towards the 1.38000 psychological level and possibly testing the strength of the 1.39014 horizontal resistance level.
As always, please apply appropriate risk management.
Happy trading!
#majorpair

Clause de non-responsabilité
Les informations et publications ne sont pas destinées à être, et ne constituent pas, des conseils ou recommandations financiers, d'investissement, de trading ou autres fournis ou approuvés par TradingView. Pour en savoir plus, consultez les Conditions d'utilisation.
Clause de non-responsabilité
Les informations et publications ne sont pas destinées à être, et ne constituent pas, des conseils ou recommandations financiers, d'investissement, de trading ou autres fournis ou approuvés par TradingView. Pour en savoir plus, consultez les Conditions d'utilisation.