

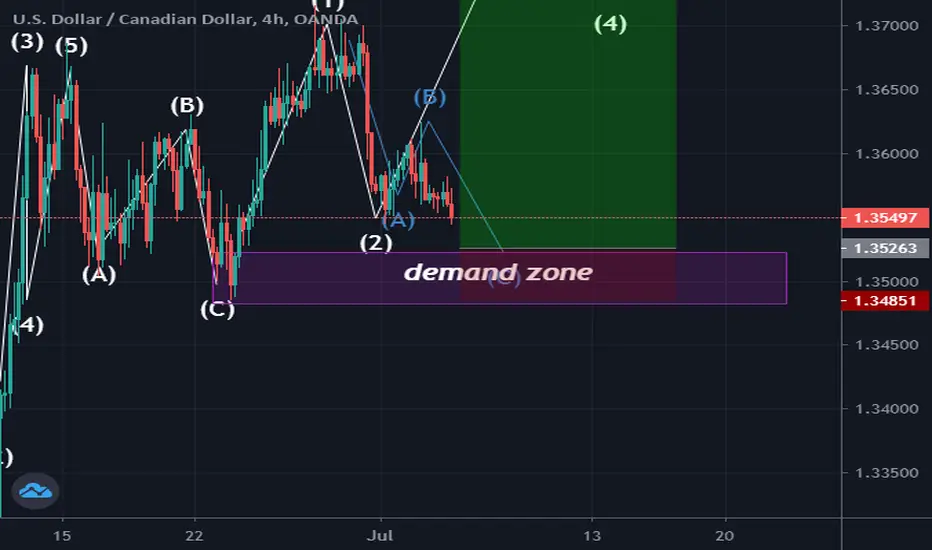
The USDCAD chart below is analyzed using both elliott wave and Demand and supply zone(the two most powerful technical analysis tools).The wave 2 of wave 3 extension is a potential zigzag in formation which on completion will end in the Demand zone(potential zone where buyers will come into the market massively) hence, a bullish rally is expected to end at the 1.618(no extension) or 2.618 (extension) fibonacci level as those are levels where wave 3 tends to end.The risk to reward ratio is compelling.......more pips guys....Kingofthemarket says hi

Clause de non-responsabilité
Les informations et publications ne sont pas destinées à être, et ne constituent pas, des conseils ou recommandations financiers, d'investissement, de trading ou autres fournis ou approuvés par TradingView. Pour en savoir plus, consultez les Conditions d'utilisation.
Clause de non-responsabilité
Les informations et publications ne sont pas destinées à être, et ne constituent pas, des conseils ou recommandations financiers, d'investissement, de trading ou autres fournis ou approuvés par TradingView. Pour en savoir plus, consultez les Conditions d'utilisation.