

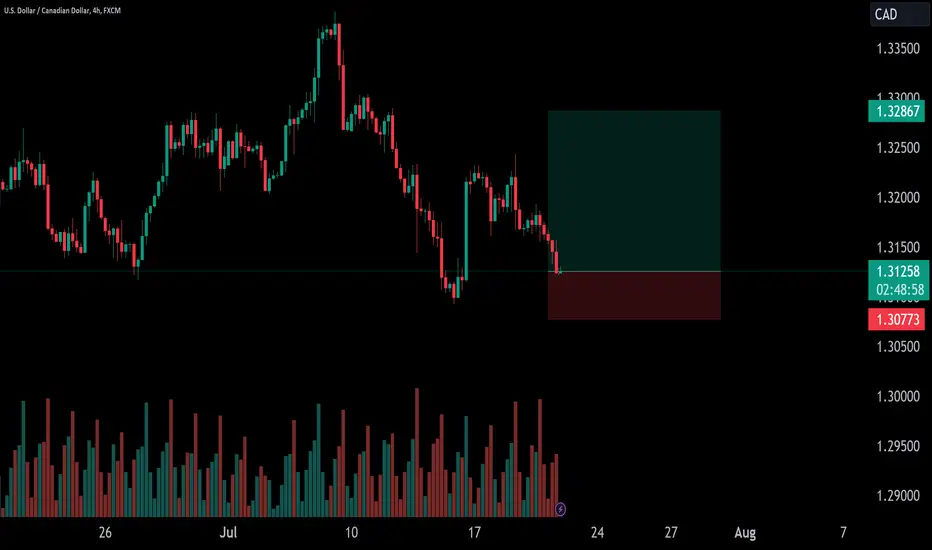
I have identified a potentially bullish move for the USD/CAD forex pair
Ascending Triangle Pattern: On the daily chart, the USD/CAD has been forming an ascending triangle pattern. This pattern is characterized by a horizontal resistance level and higher lows, indicating potential bullish pressure building up. A breakout above the resistance level could trigger a strong upward move.
Bullish Divergence: The Relative Strength Index (RSI) on the daily chart is showing a bullish divergence. While the price has been making lower lows, the RSI is forming higher lows, suggesting that the bearish momentum is weakening and a potential reversal could occur.
Moving Averages: The 50-day moving average (MA) has recently crossed above the 200-day MA, confirming a bullish crossover known as the "golden cross." This crossover signals a shift in momentum and supports the bullish bias.
Support Confirmation: The USD/CAD has recently tested and held firm at a key support level , providing further evidence of potential upward movement.
Ascending Triangle Pattern: On the daily chart, the USD/CAD has been forming an ascending triangle pattern. This pattern is characterized by a horizontal resistance level and higher lows, indicating potential bullish pressure building up. A breakout above the resistance level could trigger a strong upward move.
Bullish Divergence: The Relative Strength Index (RSI) on the daily chart is showing a bullish divergence. While the price has been making lower lows, the RSI is forming higher lows, suggesting that the bearish momentum is weakening and a potential reversal could occur.
Moving Averages: The 50-day moving average (MA) has recently crossed above the 200-day MA, confirming a bullish crossover known as the "golden cross." This crossover signals a shift in momentum and supports the bullish bias.
Support Confirmation: The USD/CAD has recently tested and held firm at a key support level , providing further evidence of potential upward movement.
Transaction en cours
stops moved to breakevenNote
take some profits hereTrade fermée: cible de profit atteinte

TradeMaster Discord | Forex & gold signals + Autobot execution on configured MT5. Dated public bot-posted signal outcomes including losses, genuine reviews and community setup help. 7-day signals + Autobot trial: discord.gg/trademaster
Clause de non-responsabilité
Les informations et publications ne sont pas destinées à être, et ne constituent pas, des conseils ou recommandations financiers, d'investissement, de trading ou autres fournis ou approuvés par TradingView. Pour en savoir plus, consultez les Conditions d'utilisation.
TradeMaster Discord | Forex & gold signals + Autobot execution on configured MT5. Dated public bot-posted signal outcomes including losses, genuine reviews and community setup help. 7-day signals + Autobot trial: discord.gg/trademaster
Clause de non-responsabilité
Les informations et publications ne sont pas destinées à être, et ne constituent pas, des conseils ou recommandations financiers, d'investissement, de trading ou autres fournis ou approuvés par TradingView. Pour en savoir plus, consultez les Conditions d'utilisation.