📉 
 USDCAD Technical Analysis (4H Timeframe)
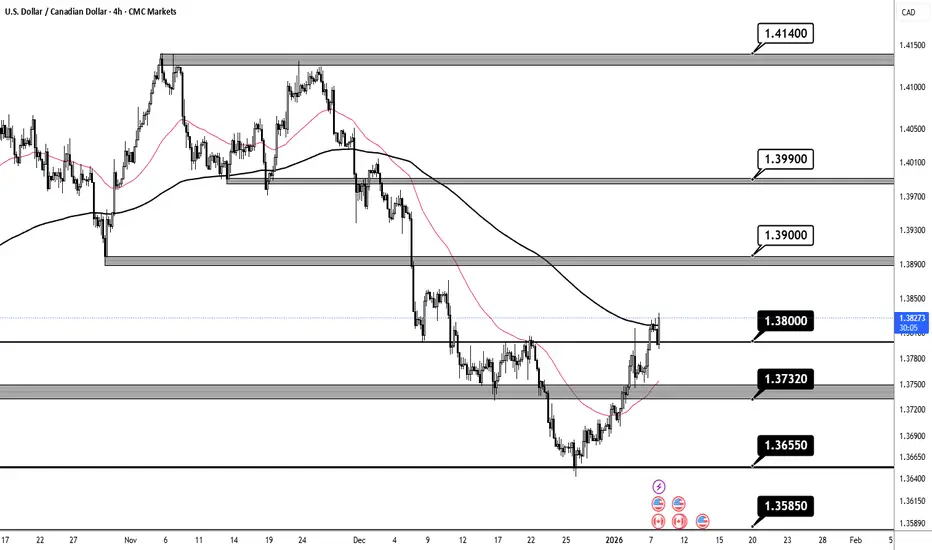
The overall trend for USD/CAD has shifted to bearish, as the price is trading below the downward-sloping EMA 200 (black line) and has established a series of lower highs and lower lows 📉. The momentum was notably strong during the descent, characterized by large bearish candle bodies. Currently, the price is in a corrective phase (wave 5 of the recent leg), attempting a pullback toward the EMA 50 (red line). The EMA 50 is currently acting as immediate dynamic resistance. If the price fails to break above the 1.38270 USD level with conviction, we expect a continuation of the primary bearish trend toward the lower liquidity zones 🐻.
🔑 Key Levels to Watch:
USDCAD Technical Analysis (4H Timeframe)The overall trend for USD/CAD has shifted to bearish, as the price is trading below the downward-sloping EMA 200 (black line) and has established a series of lower highs and lower lows 📉. The momentum was notably strong during the descent, characterized by large bearish candle bodies. Currently, the price is in a corrective phase (wave 5 of the recent leg), attempting a pullback toward the EMA 50 (red line). The EMA 50 is currently acting as immediate dynamic resistance. If the price fails to break above the 1.38270 USD level with conviction, we expect a continuation of the primary bearish trend toward the lower liquidity zones 🐻.
🔑 Key Levels to Watch:
- Major Resistance Zone: 1.41400 USD (Primary Origin Grey Box) 🚩
- Secondary Resistance: 1.39900 USD & 1.39000 USD (Grey Boxes) 🎯
- Immediate Pivot Resistance: 1.38270 USD (Current Test Area) 💡
- First Downside Target: 1.37320 USD (Recent Support / Grey Box) ⚡
- Secondary Support Level: 1.36550 USD (Solid Black Line) 🛡️
- Ultimate Demand Target: 1.35850 USD (Dashed Line) 📥

Publications connexes
Clause de non-responsabilité
Les informations et publications ne sont pas destinées à être, et ne constituent pas, des conseils ou recommandations financiers, d'investissement, de trading ou autres fournis ou approuvés par TradingView. Pour en savoir plus, consultez les Conditions d'utilisation.
Clause de non-responsabilité
Les informations et publications ne sont pas destinées à être, et ne constituent pas, des conseils ou recommandations financiers, d'investissement, de trading ou autres fournis ou approuvés par TradingView. Pour en savoir plus, consultez les Conditions d'utilisation.