

Good time of the days traders,
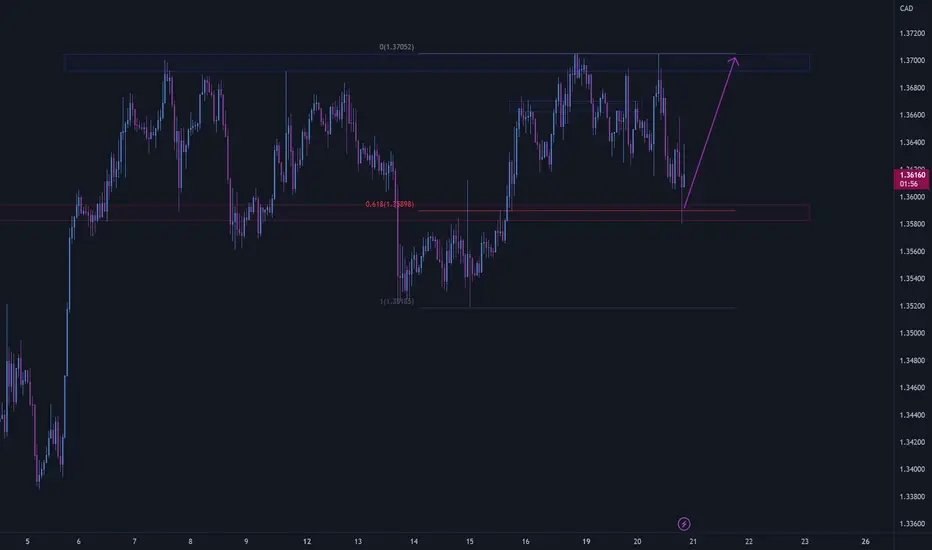
The chart above is pretty self-explanatory, but let's take a closer look at what's happening there. As we're approaching the last full trading week of the year, USDCAD is visibly stuck in the 1.36-1.37 box. If we zoom in at 1.359, we can see a 0.618 Fib zone coinciding with a support zone of decent relevance. This has caused the current rejection on H4 timeframe. If we were able to approach that zone again with the signs of further reversal, we would easily eye 1.37 zone in that 1:3 RR long trade that can happen by tomorrow.
Either way, as always let's continue observing the price development and act accordingly.
The chart above is pretty self-explanatory, but let's take a closer look at what's happening there. As we're approaching the last full trading week of the year, USDCAD is visibly stuck in the 1.36-1.37 box. If we zoom in at 1.359, we can see a 0.618 Fib zone coinciding with a support zone of decent relevance. This has caused the current rejection on H4 timeframe. If we were able to approach that zone again with the signs of further reversal, we would easily eye 1.37 zone in that 1:3 RR long trade that can happen by tomorrow.
Either way, as always let's continue observing the price development and act accordingly.

Clause de non-responsabilité
Les informations et publications ne sont pas destinées à être, et ne constituent pas, des conseils ou recommandations financiers, d'investissement, de trading ou autres fournis ou approuvés par TradingView. Pour en savoir plus, consultez les Conditions d'utilisation.
Clause de non-responsabilité
Les informations et publications ne sont pas destinées à être, et ne constituent pas, des conseils ou recommandations financiers, d'investissement, de trading ou autres fournis ou approuvés par TradingView. Pour en savoir plus, consultez les Conditions d'utilisation.