

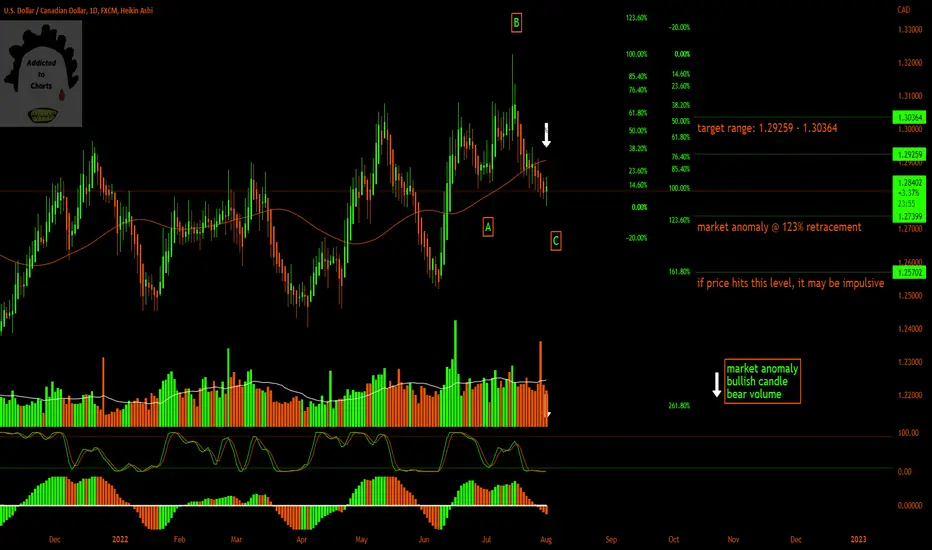
Looks like we located a potential market anomaly on the daily timeframe. Wave C has reached the 123% where the anomaly was spotted (bullish candle, bearish volume). If price reaches 161% before the bullish move, this trend might be impulsive instead of corrective. Looking for price to test the high of wave B between 38% to 61%. The RSI and MACD are both matching the bottom side. Happy trading!
What do you think?
What do you think?

Clause de non-responsabilité
Les informations et publications ne sont pas destinées à être, et ne constituent pas, des conseils ou recommandations financiers, d'investissement, de trading ou autres fournis ou approuvés par TradingView. Pour en savoir plus, consultez les Conditions d'utilisation.
Clause de non-responsabilité
Les informations et publications ne sont pas destinées à être, et ne constituent pas, des conseils ou recommandations financiers, d'investissement, de trading ou autres fournis ou approuvés par TradingView. Pour en savoir plus, consultez les Conditions d'utilisation.