

Let's debunk some headlines like "The Dollar is Bearish!" and dig into the real chart dynamics. On the weekly chart, a bullish trend is evident, despite a retracement that might seem bearish. Always consider the bigger picture. The recent retracement is a mere blip compared to the overall uptrend.
🔍 Key Levels to Watch 🔍
Zoom out and observe the retest happening on the previous high. Keep a close eye on whether the market breaches 145.24. The next crucial level to watch is 152.02. Chart analysis trumps online articles. Don't just read, define your levels strategically.
💡 Daily Chart Insights 💡
Approaching the previous high on the daily chart, counter-trend traders might eye shorting opportunities. However, wait for candlestick confirmation before executing. Personally, I see a breakout trading opportunity, not an aggressive short.
📊 Four Hour Chart Dynamics 📊
New highs surpassing previous structures on the four-hour chart indicate the bullish trend persists. This trend isn't over. One hour chart mirrors this pattern—a break of prior resistance.
📚 Mastering Market Analysis 📚
If you're passionate about analyzing markets like I am, employing clear rules for buying and selling levels is vital. No guessing games. Scan the QR code for our community channel. Engage with like-minded individuals and refine your skills.
💼 Crafting Trading Strategies 💼
Returning to the weekly chart, counter-traders might spot a shorting setup at 149.28 for a Fib-3 Bat setup. On the daily chart, a crab pattern at 150.39 forms, with a Bat pattern completion at 149.16.
⚙️ Shorting Opportunities ⚙️
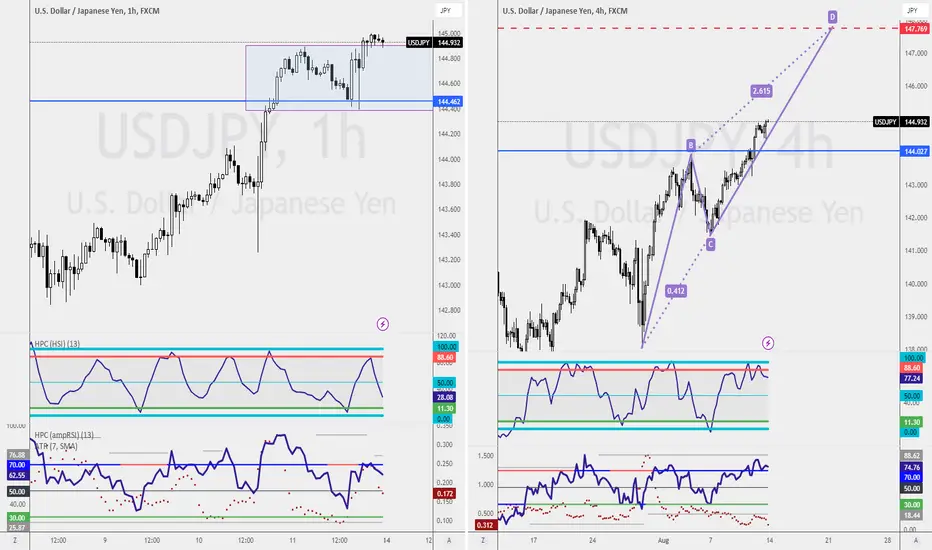
For those inclined towards shorting, the ABCD pattern on the four-hour chart sets a stage at 147.80. My focus? Buying opportunities. A pullback to 144.02 holds potential for a buying window.
🔎 Immediate Insights 🔎
On the one-hour chart, a closer level of interest stands at 144.46—a promising buying opportunity within the buy zone.
🔍 Key Levels to Watch 🔍
Zoom out and observe the retest happening on the previous high. Keep a close eye on whether the market breaches 145.24. The next crucial level to watch is 152.02. Chart analysis trumps online articles. Don't just read, define your levels strategically.
💡 Daily Chart Insights 💡
Approaching the previous high on the daily chart, counter-trend traders might eye shorting opportunities. However, wait for candlestick confirmation before executing. Personally, I see a breakout trading opportunity, not an aggressive short.
📊 Four Hour Chart Dynamics 📊
New highs surpassing previous structures on the four-hour chart indicate the bullish trend persists. This trend isn't over. One hour chart mirrors this pattern—a break of prior resistance.
📚 Mastering Market Analysis 📚
If you're passionate about analyzing markets like I am, employing clear rules for buying and selling levels is vital. No guessing games. Scan the QR code for our community channel. Engage with like-minded individuals and refine your skills.
💼 Crafting Trading Strategies 💼
Returning to the weekly chart, counter-traders might spot a shorting setup at 149.28 for a Fib-3 Bat setup. On the daily chart, a crab pattern at 150.39 forms, with a Bat pattern completion at 149.16.
⚙️ Shorting Opportunities ⚙️
For those inclined towards shorting, the ABCD pattern on the four-hour chart sets a stage at 147.80. My focus? Buying opportunities. A pullback to 144.02 holds potential for a buying window.
🔎 Immediate Insights 🔎
On the one-hour chart, a closer level of interest stands at 144.46—a promising buying opportunity within the buy zone.

🧑🏫Analysis now at Substack
🕒 Work 15mins to earn additional income
🏦 Qualify Financial Analyst within 90days
🎤 Keynote Speaker
🧠 21yrs in trading
🚀 Get into our Discord to receive our live market analysis!
discord.gg/AKDr9vPqH7
🕒 Work 15mins to earn additional income
🏦 Qualify Financial Analyst within 90days
🎤 Keynote Speaker
🧠 21yrs in trading
🚀 Get into our Discord to receive our live market analysis!
discord.gg/AKDr9vPqH7
Clause de non-responsabilité
Les informations et publications ne sont pas destinées à être, et ne constituent pas, des conseils ou recommandations financiers, d'investissement, de trading ou autres fournis ou approuvés par TradingView. Pour en savoir plus, consultez les Conditions d'utilisation.
🧑🏫Analysis now at Substack
🕒 Work 15mins to earn additional income
🏦 Qualify Financial Analyst within 90days
🎤 Keynote Speaker
🧠 21yrs in trading
🚀 Get into our Discord to receive our live market analysis!
discord.gg/AKDr9vPqH7
🕒 Work 15mins to earn additional income
🏦 Qualify Financial Analyst within 90days
🎤 Keynote Speaker
🧠 21yrs in trading
🚀 Get into our Discord to receive our live market analysis!
discord.gg/AKDr9vPqH7
Clause de non-responsabilité
Les informations et publications ne sont pas destinées à être, et ne constituent pas, des conseils ou recommandations financiers, d'investissement, de trading ou autres fournis ou approuvés par TradingView. Pour en savoir plus, consultez les Conditions d'utilisation.