

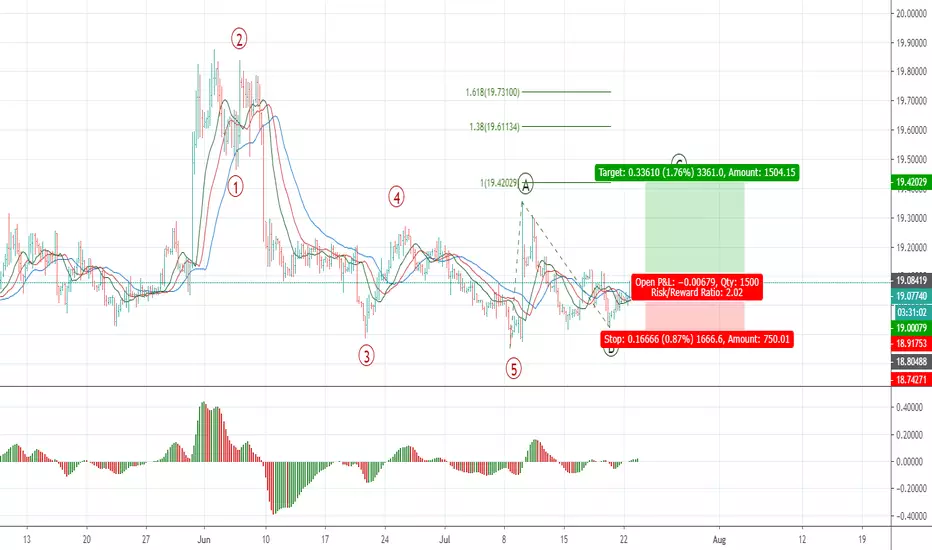
On the H4 chart of USDMXN, the price has formed a promising buy fractal above the balance MAs with AO indicator over the zero line. This signal is supported by Elliott wave structure: with high probability, we are moving in an ABC corrective zigzag, more accurately, in wave C. This gives me an idea to go long using levels that are marked on the chart.

Clause de non-responsabilité
Les informations et publications ne sont pas destinées à être, et ne constituent pas, des conseils ou recommandations financiers, d'investissement, de trading ou autres fournis ou approuvés par TradingView. Pour en savoir plus, consultez les Conditions d'utilisation.
Clause de non-responsabilité
Les informations et publications ne sont pas destinées à être, et ne constituent pas, des conseils ou recommandations financiers, d'investissement, de trading ou autres fournis ou approuvés par TradingView. Pour en savoir plus, consultez les Conditions d'utilisation.