
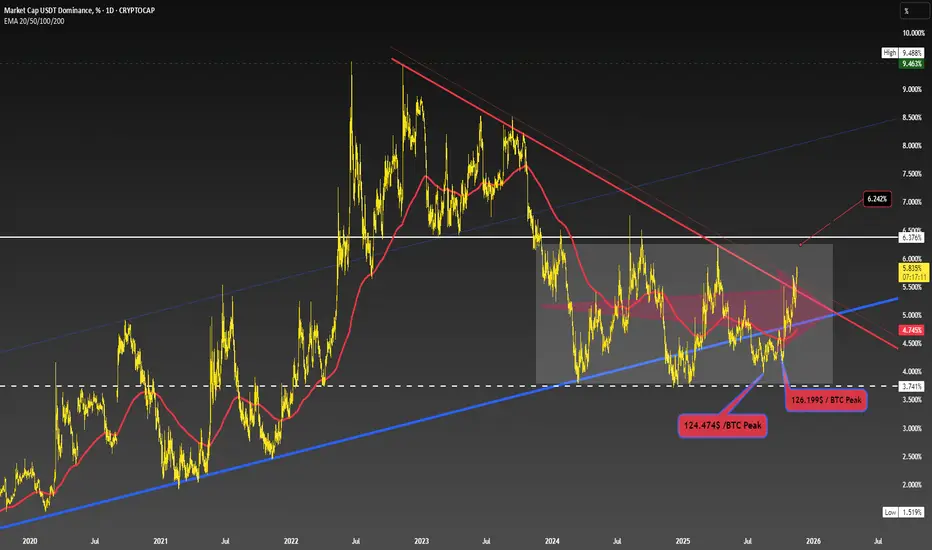
You can clearly see a descending structure here, but the sideways movement between 3.74% and 6.37% is also quite notable. The 6.24% level stands out as the first key resistance target.
If 6.24% fails to break and hold above, a pullback may occur.
So this region is crucial for determining whether USDT Dominance will continue higher or reject and reverse.
Also, the 6.24% level in USDT.D corresponds approximately to a $90,500 BTC price, making this zone even more important to watch.
If 6.24% fails to break and hold above, a pullback may occur.
So this region is crucial for determining whether USDT Dominance will continue higher or reject and reverse.
Also, the 6.24% level in USDT.D corresponds approximately to a $90,500 BTC price, making this zone even more important to watch.
Note
This is not financial advice.
Publications connexes
Clause de non-responsabilité
Les informations et publications ne sont pas destinées à être, et ne constituent pas, des conseils ou recommandations financiers, d'investissement, de trading ou autres fournis ou approuvés par TradingView. Pour en savoir plus, consultez les Conditions d'utilisation.