
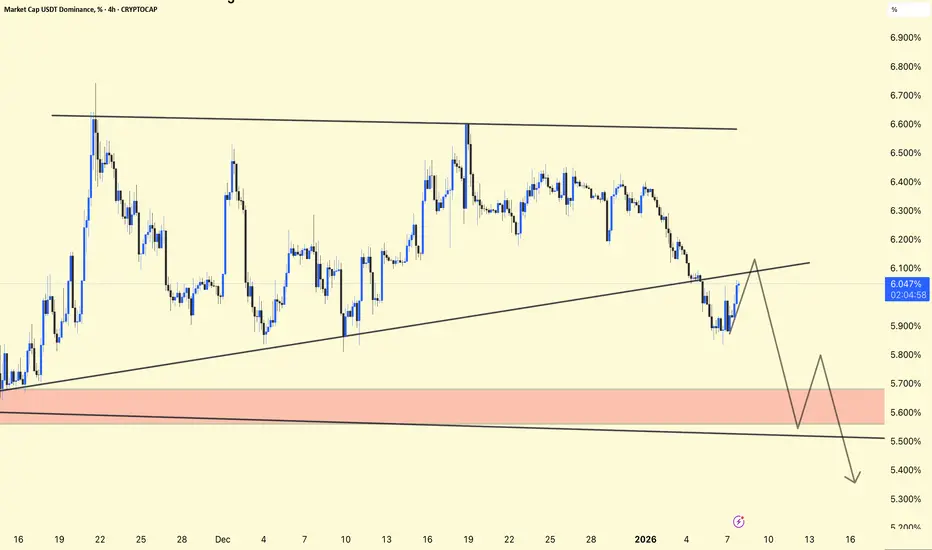
USDT Dominance – Chart Update
USDT.D is currently holding an ascending trendline support
A short-term bounce or pullback is possible from this area
Overall structure still shows a bearish bias
Resistance: 6.10% – 6.20%
Major Support / Demand Zone: 5.60% – 5.55%
Rejection from 6.10–6.20% → Positive for altcoins
Break and hold above resistance → Market may turn risk-off short term
USDT Dominance is gradually showing downside pressure.
A clean breakdown below 5.60% could signal a strong altcoin rally.
For educational purposes only. Not financial advice.

Publications connexes
Clause de non-responsabilité
Les informations et publications ne sont pas destinées à être, et ne constituent pas, des conseils ou recommandations financiers, d'investissement, de trading ou autres fournis ou approuvés par TradingView. Pour en savoir plus, consultez les Conditions d'utilisation.