
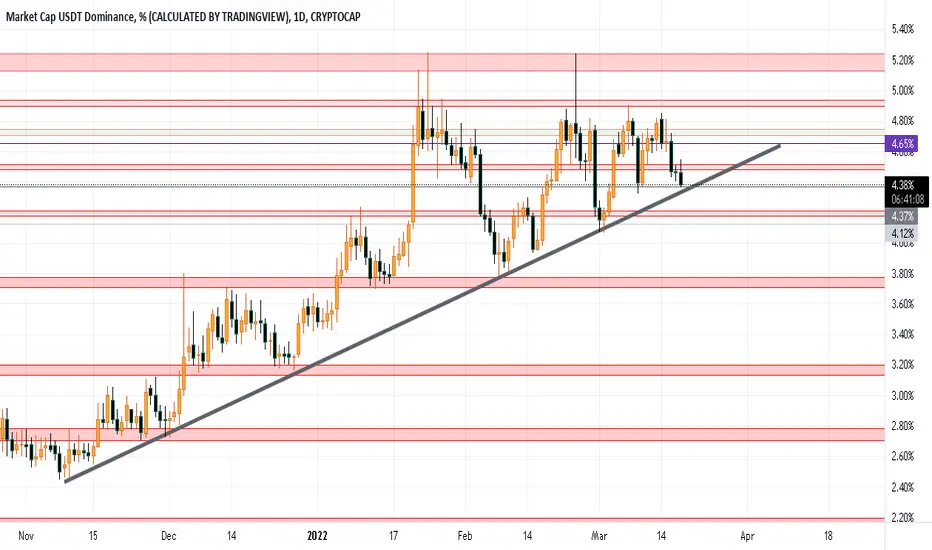
Guys this is USDT.D Chart, this chart indicates a ViceVersa movement with the overall crypto currency market! That means whenever USDT.D drops the market is Bullish, and whenever it moves up the market turns Bearish!
So right now we can see that USDT.D is in an important area, Keep an eye on the support trendline maybe it get supported and the market turn Bearish for short term! so then we can open Short positions with a good risk management! or if the support trend line got broken, then we will wait for a pullback for a confirmation for a extreme Bullish market!
Please check my previous technical Analysis ideas link below!

Publications connexes
Clause de non-responsabilité
Les informations et publications ne sont pas destinées à être, et ne constituent pas, des conseils ou recommandations financiers, d'investissement, de trading ou autres fournis ou approuvés par TradingView. Pour en savoir plus, consultez les Conditions d'utilisation.