
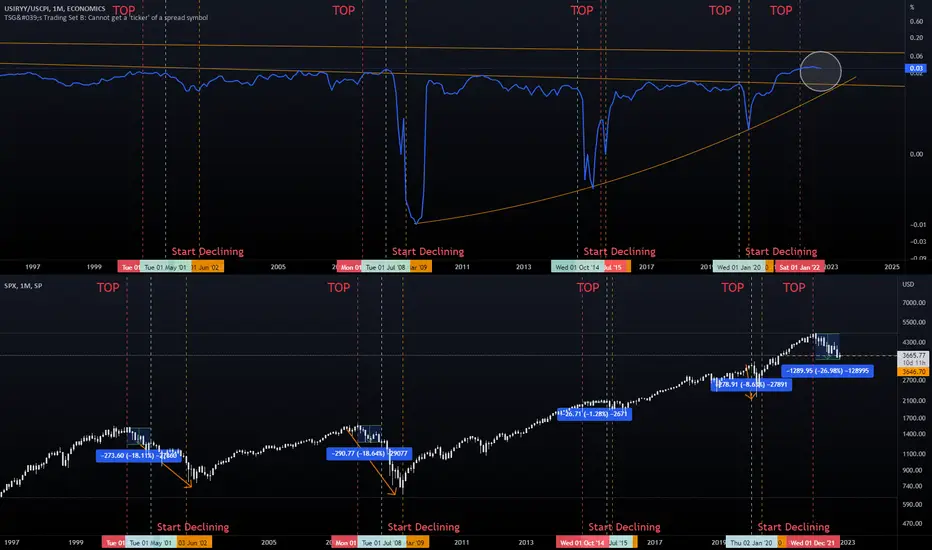
As you can see - all crashes on SPX have been synced with the above chart dipping big time.
What do we have now ? The chart hasn't even gone down - yet SPX has dipped -27%.
The difference between SPX's TOP and the start of declining of Inflation Rate / CPI is of an average 15-18% decline on SPX.
The only problem is that we haven't even started properly declining (circled area).
Two assumptions based on this - Either we still have time in this market and this was just a correction...
or...
... the fall will be huge.
Personally expecting markets to recover a bit and soon inflation rate will spike down together with SPX falling.
Not investing big time before seeing a proper spike down.
Cheers!
What do we have now ? The chart hasn't even gone down - yet SPX has dipped -27%.
The difference between SPX's TOP and the start of declining of Inflation Rate / CPI is of an average 15-18% decline on SPX.
The only problem is that we haven't even started properly declining (circled area).
Two assumptions based on this - Either we still have time in this market and this was just a correction...
or...
... the fall will be huge.
Personally expecting markets to recover a bit and soon inflation rate will spike down together with SPX falling.
Not investing big time before seeing a proper spike down.
Cheers!
Note
Another observation - From SPX TOP to the Declining we always had 9 months (except on the rushing Covid crash) - From there we need to monitor Inflation to dip and start investing again. We are at 8 months now.

Clause de non-responsabilité
Les informations et publications ne sont pas destinées à être, et ne constituent pas, des conseils ou recommandations financiers, d'investissement, de trading ou autres fournis ou approuvés par TradingView. Pour en savoir plus, consultez les Conditions d'utilisation.
Clause de non-responsabilité
Les informations et publications ne sont pas destinées à être, et ne constituent pas, des conseils ou recommandations financiers, d'investissement, de trading ou autres fournis ou approuvés par TradingView. Pour en savoir plus, consultez les Conditions d'utilisation.