
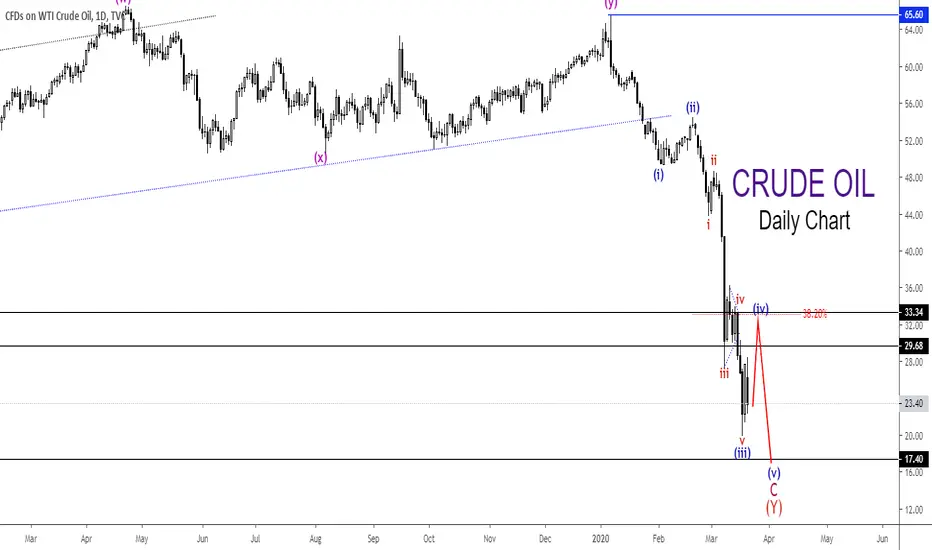
Crude Oil daily chart above revealed that the downtrend since January 8, 2020, high is unfolding as a five-wave impulse. The pattern is labeled (i)-(ii)-(iii)-(iv)-(v), where the sub-waves of wave (iii) is also visible. Wave ii of (iii) was a sharp pattern, and wave iv of (iii) unfolded as a sideways triangle pattern.
The Wave theory states that a three-wave correction in the opposite direction follows every impulse. So, the decline to $20 on March 18 must be the end of wave (iii) of the five-wave impulse pattern.
This, in turn, meant that once the recovery in wave (iv) ended, another selloff in wave (v) would be very likely.
Wave (iv) has the potential to find resistance around 38.2% Fibonacci level that lined up with a resistance zone, which will be a good area to look for a short entry on Oil.
What's your view on Crude Oil?
The Wave theory states that a three-wave correction in the opposite direction follows every impulse. So, the decline to $20 on March 18 must be the end of wave (iii) of the five-wave impulse pattern.
This, in turn, meant that once the recovery in wave (iv) ended, another selloff in wave (v) would be very likely.
Wave (iv) has the potential to find resistance around 38.2% Fibonacci level that lined up with a resistance zone, which will be a good area to look for a short entry on Oil.
What's your view on Crude Oil?

Clause de non-responsabilité
Les informations et publications ne sont pas destinées à être, et ne constituent pas, des conseils ou recommandations financiers, d'investissement, de trading ou autres fournis ou approuvés par TradingView. Pour en savoir plus, consultez les Conditions d'utilisation.
Clause de non-responsabilité
Les informations et publications ne sont pas destinées à être, et ne constituent pas, des conseils ou recommandations financiers, d'investissement, de trading ou autres fournis ou approuvés par TradingView. Pour en savoir plus, consultez les Conditions d'utilisation.