
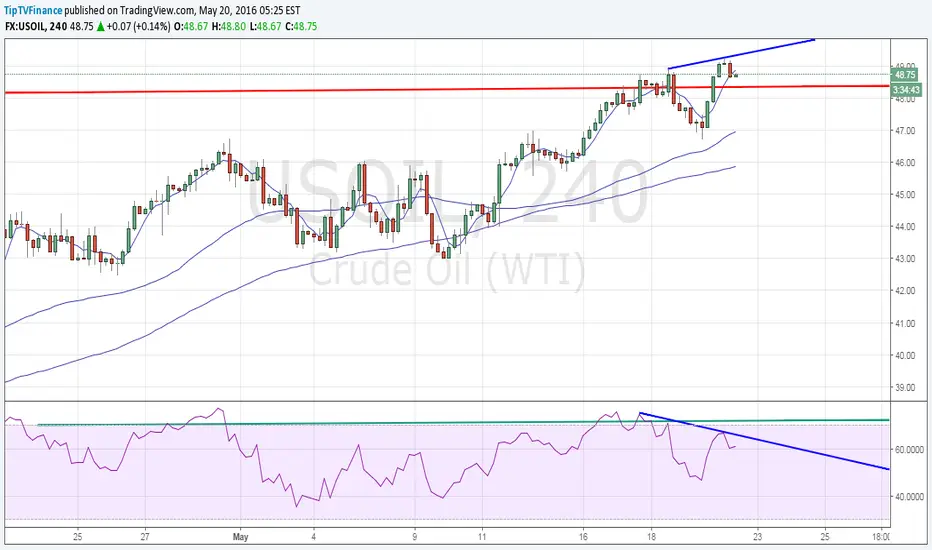
Prices hit a high of $49.14 before trimming gains to trade around $48.80 levels.
- 4-hour chart shows a bearish price RSI divergence.
- Also note, futures show a gap up opening today. The gap is between $48.22 and $48.82 levels.
- In the light of bearish price RSI divergence, prices appear likely to fill the gap ahead of NY closing.
- On a larger scheme of things, bullish invalidation is seen only if prices see a day end closing below Apr 29 high.

Publications connexes
Clause de non-responsabilité
Les informations et publications ne sont pas destinées à être, et ne constituent pas, des conseils ou recommandations financiers, d'investissement, de trading ou autres fournis ou approuvés par TradingView. Pour en savoir plus, consultez les Conditions d'utilisation.
Publications connexes
Clause de non-responsabilité
Les informations et publications ne sont pas destinées à être, et ne constituent pas, des conseils ou recommandations financiers, d'investissement, de trading ou autres fournis ou approuvés par TradingView. Pour en savoir plus, consultez les Conditions d'utilisation.