
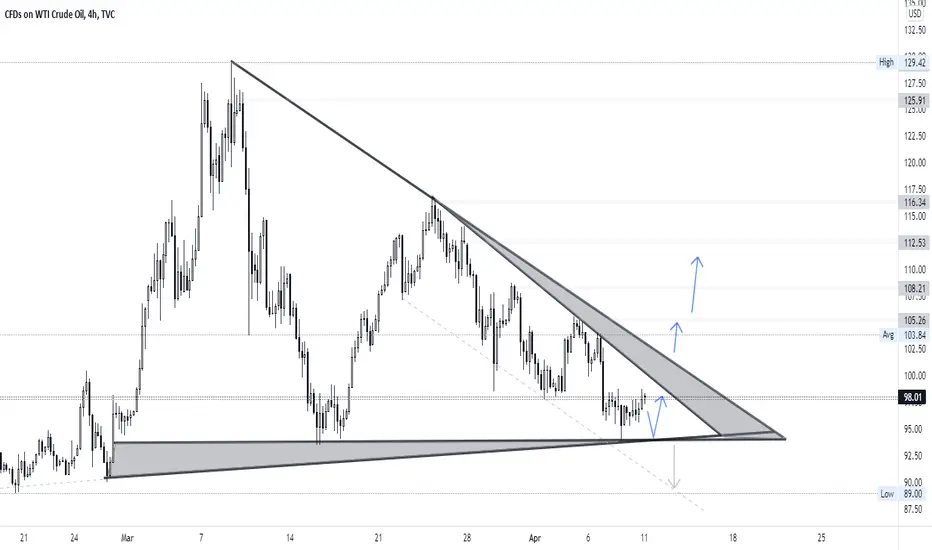
This is the technical analysis of USO H4. Based on chart pattern analysis. We can find a triangle pattern with an advanced trendline for more accurate confirmation,
The direction of the trend tends to be bullish, we can take this opportunity to take a long position :
1. The price is still moving in the triangle area.
2. Moderate buy action is possible if the price breakout of the triangle resistance area.
On the other hand, there are risks that need to be considered: currently Covid cases are rise, all activities will be limited, this could make oil fall. if the oil price continues to fall it will breakout the support area.
The direction of the trend tends to be bullish, we can take this opportunity to take a long position :
1. The price is still moving in the triangle area.
2. Moderate buy action is possible if the price breakout of the triangle resistance area.
On the other hand, there are risks that need to be considered: currently Covid cases are rise, all activities will be limited, this could make oil fall. if the oil price continues to fall it will breakout the support area.

Clause de non-responsabilité
Les informations et publications ne sont pas destinées à être, et ne constituent pas, des conseils ou recommandations financiers, d'investissement, de trading ou autres fournis ou approuvés par TradingView. Pour en savoir plus, consultez les Conditions d'utilisation.
Clause de non-responsabilité
Les informations et publications ne sont pas destinées à être, et ne constituent pas, des conseils ou recommandations financiers, d'investissement, de trading ou autres fournis ou approuvés par TradingView. Pour en savoir plus, consultez les Conditions d'utilisation.