
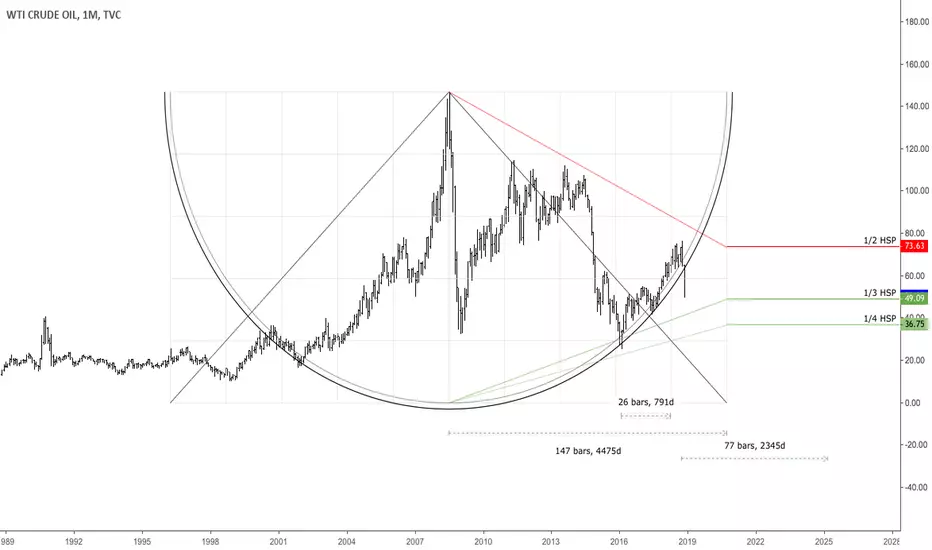
This is a monthly chart of USOIL with time cycles from important tops and bottoms. As shown in the chart, the current decline in oil started after 26 monthly bars since the bottom of $26 and around the 1/2 price area from highest selling price. Possible major pivot around the $48 area, which is the 1/3 of highest selling price of oil. If that goes, the next important area is the 1/4 of highest selling price around $36. It seems reasonable to look for long-term pivot around these price areas.

Clause de non-responsabilité
Les informations et publications ne sont pas destinées à être, et ne constituent pas, des conseils ou recommandations financiers, d'investissement, de trading ou autres fournis ou approuvés par TradingView. Pour en savoir plus, consultez les Conditions d'utilisation.
Clause de non-responsabilité
Les informations et publications ne sont pas destinées à être, et ne constituent pas, des conseils ou recommandations financiers, d'investissement, de trading ou autres fournis ou approuvés par TradingView. Pour en savoir plus, consultez les Conditions d'utilisation.