
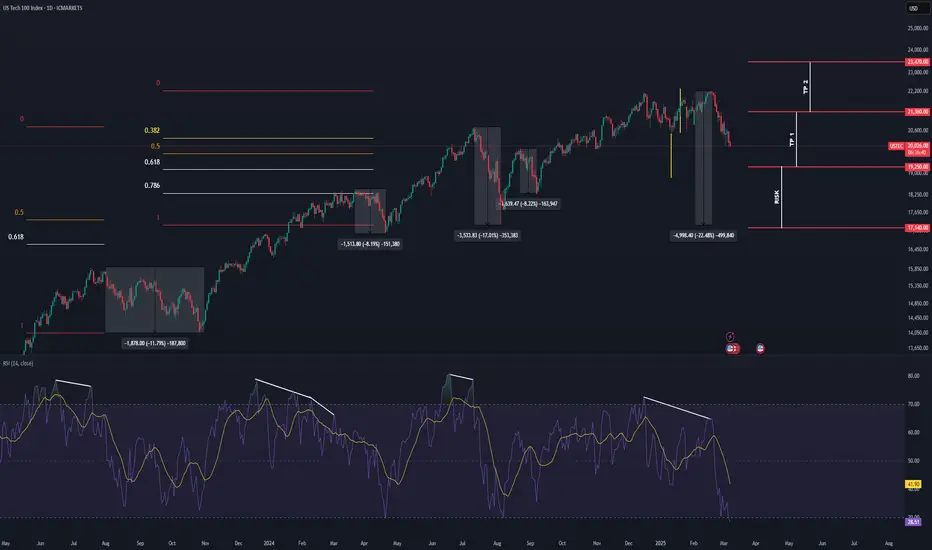
NASDAQ price seems to exhibit signs of a major correction as the price action has broken out of it's range.
During the pandemic (Covid-19), NASDAQ experienced two major corrections (worth drops of approx. 18.35% and approx. 24%). Counting these two massive corrections as anomalies, the NASDAQ on average retraces maximum around approx. 17% - 18.5% from a historical perspective.
Once the selling subsides we may potentially see the formation of a credible Higher Low on the Longer Timeframes with multiple confluences from key Fibonacci and Support levels.
The current Trade Plan caters to a drop of approx. 22.5% (to be on the safer side and potentially accounts for a major correction excluding massive systematic failure).
Trade Plan :
Entry @ 19250
Stop Loss @ 17140
TP 1 @ 21360 (Before All Time High)
TP 2 @ 23470 (After All Time High)
Note: Move Stop Loss to Break Even if TP 1 hits.
During the pandemic (Covid-19), NASDAQ experienced two major corrections (worth drops of approx. 18.35% and approx. 24%). Counting these two massive corrections as anomalies, the NASDAQ on average retraces maximum around approx. 17% - 18.5% from a historical perspective.
Once the selling subsides we may potentially see the formation of a credible Higher Low on the Longer Timeframes with multiple confluences from key Fibonacci and Support levels.
The current Trade Plan caters to a drop of approx. 22.5% (to be on the safer side and potentially accounts for a major correction excluding massive systematic failure).
Trade Plan :
Entry @ 19250
Stop Loss @ 17140
TP 1 @ 21360 (Before All Time High)
TP 2 @ 23470 (After All Time High)
Note: Move Stop Loss to Break Even if TP 1 hits.
Note
Slight Correction: During the pandemic (Covid-19), NASDAQ experienced two major corrections (worth drops of approx. 24% and approx. 37.9%). Counting these two massive corrections as anomalies, the NASDAQ on average retraces maximum around approx. 17% - 18.5% from a historical perspective.Transaction en cours
TRADE UPDATE!PLACE SL @ 16850
NEW TP 1 @ 21650
NEW TP 2 @ 24050
A more cautionary stance.

Clause de non-responsabilité
Les informations et publications ne sont pas destinées à être, et ne constituent pas, des conseils ou recommandations financiers, d'investissement, de trading ou autres fournis ou approuvés par TradingView. Pour en savoir plus, consultez les Conditions d'utilisation.
Clause de non-responsabilité
Les informations et publications ne sont pas destinées à être, et ne constituent pas, des conseils ou recommandations financiers, d'investissement, de trading ou autres fournis ou approuvés par TradingView. Pour en savoir plus, consultez les Conditions d'utilisation.