
1. General Overview
Ticker: Vistance Networks, Inc. (NASDAQ)
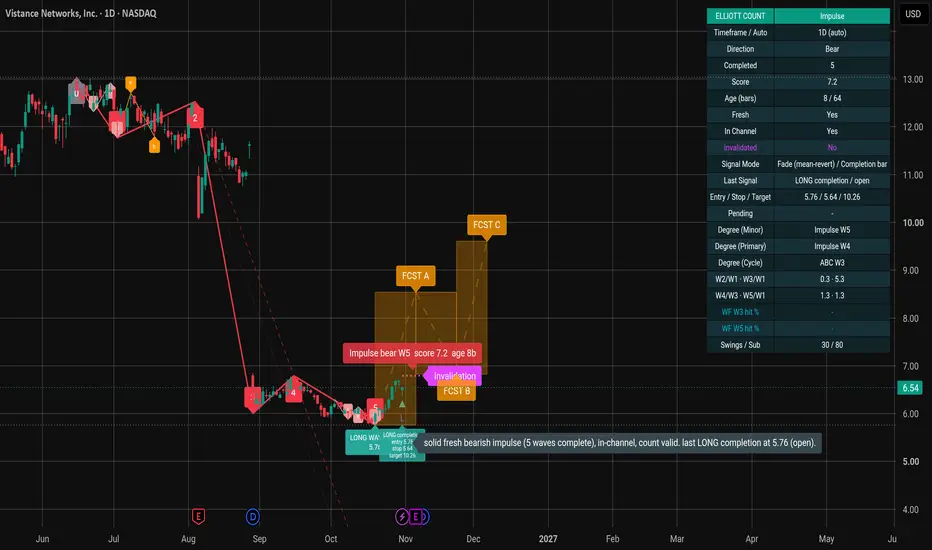
Current Price: $6.54 (as of the chart's timestamp: Oct 31, 2026)
Timeframe: 1 Day (1D)
Current Daily Change: -$0.15 (-2.24%), indicating continued near-term weakness.
Primary Tool: An automated Elliott Wave counting indicator (evident from the wave labels, forecast boxes, and the data panel on the right).
2. Elliott Wave Analysis
The system indicates that a Bearish Impulse wave structure has completed, suggesting a potential trend reversal or significant bounce. Here is the breakdown:
Direction: Bearish. The chart displays a pronounced downtrend starting from highs around $13.00 down to the recent lows near $5.50.
Count Completed: 5. The indicator marks a classic five-wave impulse structure, with wave 5 ending at the recent bottom. The chart explicitly marks the sequence with red and pink flags numbered 1, 2, 3, 4, and 5.
Signal Mode: "Fade (mean-revert) / Completion bar." Because a 5-wave impulse typically signifies trend exhaustion, the indicator anticipates a counter-trend reversal (a bounce).
Indicator Confidence: The setup has a Score of 7.2 (out of 10) and is marked as "Fresh: Yes" and "Invalidated: No".
Indicator Text Box: A text box on the chart reads: "solid fresh bearish impulse (5 waves complete), in-channel, count valid. last LONG completion at 5.76 (open)."
3. Current Trading Signal
Because the indicator considers the bearish impulse complete, it has generated an active LONG (Buy) signal, expecting a corrective bounce.
The specific trade parameters highlighted on the chart are:
Entry Price: $5.76
Stop Loss: **$5.64** (Risk of only $0.12 per share)
Target Price: **$10.26** (Reward of $4.50 per share)
Risk/Reward Ratio: Approximately 1:37.5, which is an exceptionally high reward-to-risk ratio.
Status: The table notes "Last Signal: LONG completion / open." The current price ($6.54) is currently trading above the entry point, meaning the trade is in profit.
4. Key Levels to Watch
Support: The immediate floor is the recent low around $5.50 - $5.64. The stop loss is placed just below this level to protect against a continuation of the downtrend.
Invalidation Level: The magenta box labeled "Invalidation" sits around the $7.00 area. If the price rallies sharply and breaks above this zone, the current wave count is incorrect, and the setup is invalidated.
Forecast Zones: The orange boxes labeled "FCST A", "FCST B", and "FCST C" represent the expected path for the upcoming corrective wave. The indicator anticipates the price will grind upwards toward these zones, with the ultimate target at $10.26.
Trendlines: The red dashed lines form a falling channel. The price is currently bouncing off the lower boundary, aligning with the completion of wave 5.
5. Summary
The automated technical system suggests that Vistance Networks has finished a protracted 5-wave decline and is heavily oversold. It is currently flashing a long signal, expecting a significant mean-reversion bounce back toward the $10.00 range. The trade is currently open and showing a profit from the initial entry at $5.76.
Disclaimer: This is an analysis of a specific third-party technical indicator's output based on the provided screenshot. It does not constitute financial advice. Automated wave counts can repaint or invalidate quickly, and past performance is not indicative of future results.
Ticker: Vistance Networks, Inc. (NASDAQ)
Current Price: $6.54 (as of the chart's timestamp: Oct 31, 2026)
Timeframe: 1 Day (1D)
Current Daily Change: -$0.15 (-2.24%), indicating continued near-term weakness.
Primary Tool: An automated Elliott Wave counting indicator (evident from the wave labels, forecast boxes, and the data panel on the right).
2. Elliott Wave Analysis
The system indicates that a Bearish Impulse wave structure has completed, suggesting a potential trend reversal or significant bounce. Here is the breakdown:
Direction: Bearish. The chart displays a pronounced downtrend starting from highs around $13.00 down to the recent lows near $5.50.
Count Completed: 5. The indicator marks a classic five-wave impulse structure, with wave 5 ending at the recent bottom. The chart explicitly marks the sequence with red and pink flags numbered 1, 2, 3, 4, and 5.
Signal Mode: "Fade (mean-revert) / Completion bar." Because a 5-wave impulse typically signifies trend exhaustion, the indicator anticipates a counter-trend reversal (a bounce).
Indicator Confidence: The setup has a Score of 7.2 (out of 10) and is marked as "Fresh: Yes" and "Invalidated: No".
Indicator Text Box: A text box on the chart reads: "solid fresh bearish impulse (5 waves complete), in-channel, count valid. last LONG completion at 5.76 (open)."
3. Current Trading Signal
Because the indicator considers the bearish impulse complete, it has generated an active LONG (Buy) signal, expecting a corrective bounce.
The specific trade parameters highlighted on the chart are:
Entry Price: $5.76
Stop Loss: **$5.64** (Risk of only $0.12 per share)
Target Price: **$10.26** (Reward of $4.50 per share)
Risk/Reward Ratio: Approximately 1:37.5, which is an exceptionally high reward-to-risk ratio.
Status: The table notes "Last Signal: LONG completion / open." The current price ($6.54) is currently trading above the entry point, meaning the trade is in profit.
4. Key Levels to Watch
Support: The immediate floor is the recent low around $5.50 - $5.64. The stop loss is placed just below this level to protect against a continuation of the downtrend.
Invalidation Level: The magenta box labeled "Invalidation" sits around the $7.00 area. If the price rallies sharply and breaks above this zone, the current wave count is incorrect, and the setup is invalidated.
Forecast Zones: The orange boxes labeled "FCST A", "FCST B", and "FCST C" represent the expected path for the upcoming corrective wave. The indicator anticipates the price will grind upwards toward these zones, with the ultimate target at $10.26.
Trendlines: The red dashed lines form a falling channel. The price is currently bouncing off the lower boundary, aligning with the completion of wave 5.
5. Summary
The automated technical system suggests that Vistance Networks has finished a protracted 5-wave decline and is heavily oversold. It is currently flashing a long signal, expecting a significant mean-reversion bounce back toward the $10.00 range. The trade is currently open and showing a profit from the initial entry at $5.76.
Disclaimer: This is an analysis of a specific third-party technical indicator's output based on the provided screenshot. It does not constitute financial advice. Automated wave counts can repaint or invalidate quickly, and past performance is not indicative of future results.

Clause de non-responsabilité
Les informations et publications ne sont pas destinées à être, et ne constituent pas, des conseils ou recommandations financiers, d'investissement, de trading ou autres fournis ou approuvés par TradingView. Pour en savoir plus, consultez les Conditions d'utilisation.
Clause de non-responsabilité
Les informations et publications ne sont pas destinées à être, et ne constituent pas, des conseils ou recommandations financiers, d'investissement, de trading ou autres fournis ou approuvés par TradingView. Pour en savoir plus, consultez les Conditions d'utilisation.