
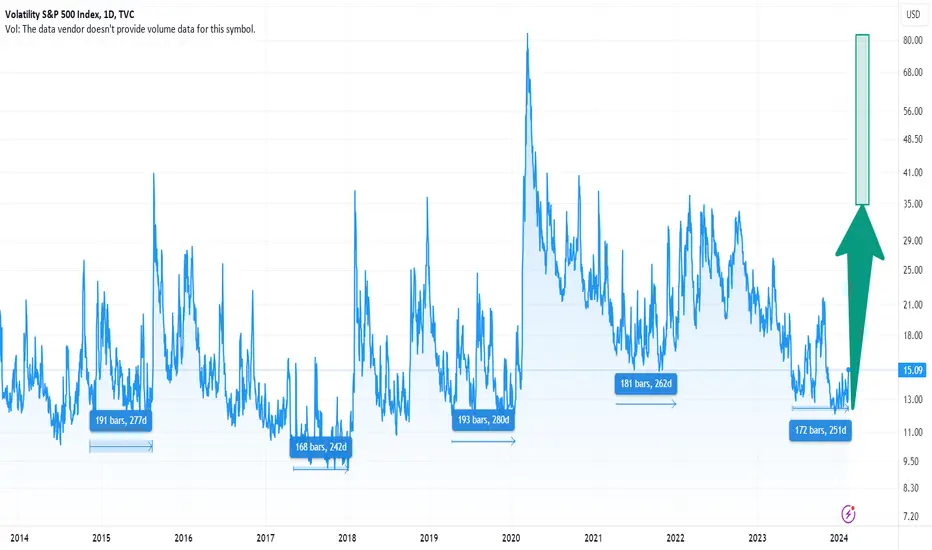
Historical data over the past 10 years shows that VIX bottoming phase usually lasts no more than 168-193 trading days. After that, a significant spike occurs, which sends the VIX to the 35-80+ zone. Even if today was not the starting point of this upside move, there is not much time left. We have already passed 172 trading days. Take this into account before establishing new positions. The date range where the VIX peak should occur is mid-March to mid-May.

Note
Target reached. Current high value is 41.80. Let's see will it spike to 50-80 range.
Note
Peaked at 65.73 within expected range.
Publications connexes
Clause de non-responsabilité
Les informations et publications ne sont pas destinées à être, et ne constituent pas, des conseils ou recommandations financiers, d'investissement, de trading ou autres fournis ou approuvés par TradingView. Pour en savoir plus, consultez les Conditions d'utilisation.