
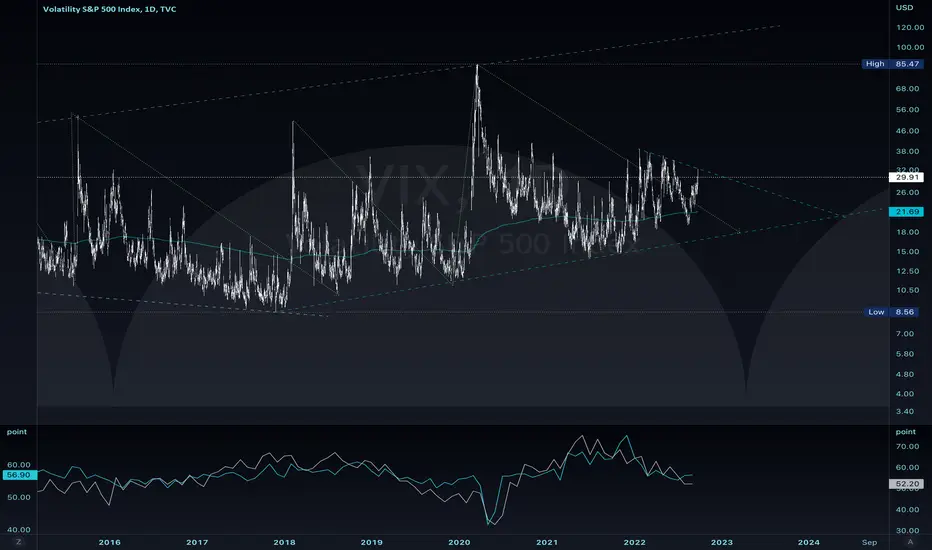
A macro view of VIX versus US Manufacturing and Non-Manufacturing PMI's with a visual aid for base time cycles.
Taking note without special emphasis of the 200 Week EMA of the VIX, which may be utilized as a confirming indicator a period of continued elevated volatility.
Chart is intended as a simple visual aid for contraction and expansion periods in the US economy.
Taking note without special emphasis of the 200 Week EMA of the VIX, which may be utilized as a confirming indicator a period of continued elevated volatility.
Chart is intended as a simple visual aid for contraction and expansion periods in the US economy.

Clause de non-responsabilité
Les informations et publications ne sont pas destinées à être, et ne constituent pas, des conseils ou recommandations financiers, d'investissement, de trading ou autres fournis ou approuvés par TradingView. Pour en savoir plus, consultez les Conditions d'utilisation.
Clause de non-responsabilité
Les informations et publications ne sont pas destinées à être, et ne constituent pas, des conseils ou recommandations financiers, d'investissement, de trading ou autres fournis ou approuvés par TradingView. Pour en savoir plus, consultez les Conditions d'utilisation.