
# VIX Is About to Break Out — Red Days Incoming
Looking at the VIX daily chart right now, my indicators are flashing a clear signal that we're approaching another volatility expansion. The market has been complacent for too long, and the setup forming on the chart tells me the calm is about to end.
## What I'm Seeing on the Chart
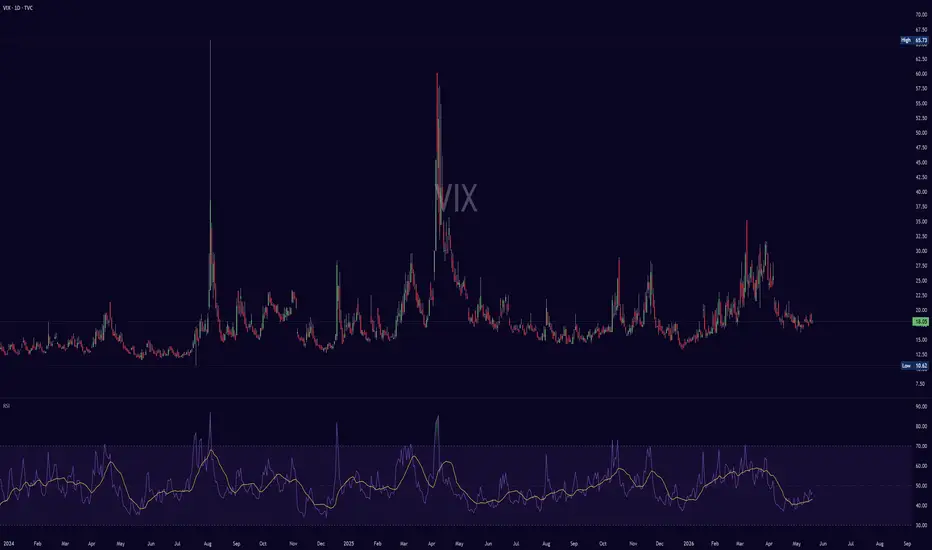
The VIX is currently sitting around 18.05 after spending the last few weeks compressed in a tight range between 17 and 19. That kind of compression doesn't last forever. The longer the VIX coils at low levels, the more energy gets stored up for the next expansion move.
My Vargha All-Trend Pro indicator just flipped on the VIX. After being firmly in red territory through April and most of May, the EMA Signal and BMSB lines are now converging and starting to curl back upward. Price has been pressing against the upper edge of the band rather than retreating from it. That's the early signature of a regime change.
The Perfect RSI in the lower pane is also turning. RSI has been hovering around the 40–45 zone for the past few weeks, but it's now pushing back toward 50 and looking like it's about to break above its moving averages. Once those RSI MAs cross back to green, the volatility expansion is confirmed.
## What This Means for the Stock Market
When the VIX breaks out of a low-volatility compression like this, it almost always coincides with selling pressure in the broader market. The VIX moves inversely to the S&P 500 about 80% of the time, and the moves are usually outsized — meaning a 20% VIX jump often corresponds to a 2–3% SPX drop in a single session.
If the VIX runs from 18 to 22–24 over the next few sessions, expect SPY to test downside levels we haven't seen in weeks. The longer the VIX has been suppressed, the sharper the move on the way out. And looking at the chart, we've been suppressed for a while.
Red days are coming. Not necessarily a crash, but the kind of weeks where dip-buyers learn the hard way that not every dip is meant to be bought. The melt-up environment we've been in is about to give way to a corrective phase where the market actually has to digest the gains it's made.
## The Geopolitical Connection
This is the part most retail traders miss. The VIX doesn't break out of compression for no reason. There's almost always a fundamental catalyst that triggers the move, even if it's not obvious at the moment of the breakout. The chart is showing us that institutional players are already positioning for some kind of shock.
When I see the VIX setting up like this, I start watching the geopolitical headlines more carefully. The pattern over the last few years has been consistent: a VIX compression breakout typically precedes by 1–3 days some kind of macro event — a Middle East escalation, a tariff announcement, a central bank surprise, a major election development, or a credit market dislocation somewhere overseas.
The fact that my indicators are firing now suggests that whatever is brewing in the background is about to hit the tape. Smart money has access to information flow that retail doesn't, and they hedge ahead of news. The VIX rising before any visible catalyst is the market telling you something is coming, even if you can't see what yet.
Watch the wires. Watch the Middle East. Watch China-Taiwan. Watch the Fed calendar. Watch credit spreads. Something is moving under the surface, and the VIX is the canary.
## How I'm Positioning
I'm taking this seriously. My playbook for the next 1–2 weeks:
I'm reducing long exposure on individual names that have been running hot. The first leg down in a VIX expansion punishes the most extended momentum names the hardest.
I'm adding selective short exposure on SPY through options. Put debit spreads are cheap right now precisely because the VIX is still suppressed. Once it breaks, those spreads pay multiples on the move. The asymmetry is excellent.
I'm holding back from new long entries unless the indicators flip back to green confluence. There's no rush to be a hero buying the first red candle. Let the move play out, let the indicators reset, and re-engage when the price action and momentum agree on a bottom.
I'm watching VIX 22 as the first confirmation level. If we break above 22 with conviction, the move is real and probably extends to 25–28 before mean reverting. If we fail at 20 and roll back over, the compression continues for another week or two before the next attempt.
## The Setup in One Sentence
The VIX is coiled, my indicators are flipping, and the combination of technical compression with the current geopolitical backdrop tells me red days are about to hit the market — possibly faster and harder than most are positioned for.
Stay sharp. Reduce risk. Don't be the bag holder when the news hits.
Looking at the VIX daily chart right now, my indicators are flashing a clear signal that we're approaching another volatility expansion. The market has been complacent for too long, and the setup forming on the chart tells me the calm is about to end.
## What I'm Seeing on the Chart
The VIX is currently sitting around 18.05 after spending the last few weeks compressed in a tight range between 17 and 19. That kind of compression doesn't last forever. The longer the VIX coils at low levels, the more energy gets stored up for the next expansion move.
My Vargha All-Trend Pro indicator just flipped on the VIX. After being firmly in red territory through April and most of May, the EMA Signal and BMSB lines are now converging and starting to curl back upward. Price has been pressing against the upper edge of the band rather than retreating from it. That's the early signature of a regime change.
The Perfect RSI in the lower pane is also turning. RSI has been hovering around the 40–45 zone for the past few weeks, but it's now pushing back toward 50 and looking like it's about to break above its moving averages. Once those RSI MAs cross back to green, the volatility expansion is confirmed.
## What This Means for the Stock Market
When the VIX breaks out of a low-volatility compression like this, it almost always coincides with selling pressure in the broader market. The VIX moves inversely to the S&P 500 about 80% of the time, and the moves are usually outsized — meaning a 20% VIX jump often corresponds to a 2–3% SPX drop in a single session.
If the VIX runs from 18 to 22–24 over the next few sessions, expect SPY to test downside levels we haven't seen in weeks. The longer the VIX has been suppressed, the sharper the move on the way out. And looking at the chart, we've been suppressed for a while.
Red days are coming. Not necessarily a crash, but the kind of weeks where dip-buyers learn the hard way that not every dip is meant to be bought. The melt-up environment we've been in is about to give way to a corrective phase where the market actually has to digest the gains it's made.
## The Geopolitical Connection
This is the part most retail traders miss. The VIX doesn't break out of compression for no reason. There's almost always a fundamental catalyst that triggers the move, even if it's not obvious at the moment of the breakout. The chart is showing us that institutional players are already positioning for some kind of shock.
When I see the VIX setting up like this, I start watching the geopolitical headlines more carefully. The pattern over the last few years has been consistent: a VIX compression breakout typically precedes by 1–3 days some kind of macro event — a Middle East escalation, a tariff announcement, a central bank surprise, a major election development, or a credit market dislocation somewhere overseas.
The fact that my indicators are firing now suggests that whatever is brewing in the background is about to hit the tape. Smart money has access to information flow that retail doesn't, and they hedge ahead of news. The VIX rising before any visible catalyst is the market telling you something is coming, even if you can't see what yet.
Watch the wires. Watch the Middle East. Watch China-Taiwan. Watch the Fed calendar. Watch credit spreads. Something is moving under the surface, and the VIX is the canary.
## How I'm Positioning
I'm taking this seriously. My playbook for the next 1–2 weeks:
I'm reducing long exposure on individual names that have been running hot. The first leg down in a VIX expansion punishes the most extended momentum names the hardest.
I'm adding selective short exposure on SPY through options. Put debit spreads are cheap right now precisely because the VIX is still suppressed. Once it breaks, those spreads pay multiples on the move. The asymmetry is excellent.
I'm holding back from new long entries unless the indicators flip back to green confluence. There's no rush to be a hero buying the first red candle. Let the move play out, let the indicators reset, and re-engage when the price action and momentum agree on a bottom.
I'm watching VIX 22 as the first confirmation level. If we break above 22 with conviction, the move is real and probably extends to 25–28 before mean reverting. If we fail at 20 and roll back over, the compression continues for another week or two before the next attempt.
## The Setup in One Sentence
The VIX is coiled, my indicators are flipping, and the combination of technical compression with the current geopolitical backdrop tells me red days are about to hit the market — possibly faster and harder than most are positioned for.
Stay sharp. Reduce risk. Don't be the bag holder when the news hits.

Clause de non-responsabilité
Les informations et publications ne sont pas destinées à être, et ne constituent pas, des conseils ou recommandations financiers, d'investissement, de trading ou autres fournis ou approuvés par TradingView. Pour en savoir plus, consultez les Conditions d'utilisation.
Clause de non-responsabilité
Les informations et publications ne sont pas destinées à être, et ne constituent pas, des conseils ou recommandations financiers, d'investissement, de trading ou autres fournis ou approuvés par TradingView. Pour en savoir plus, consultez les Conditions d'utilisation.