
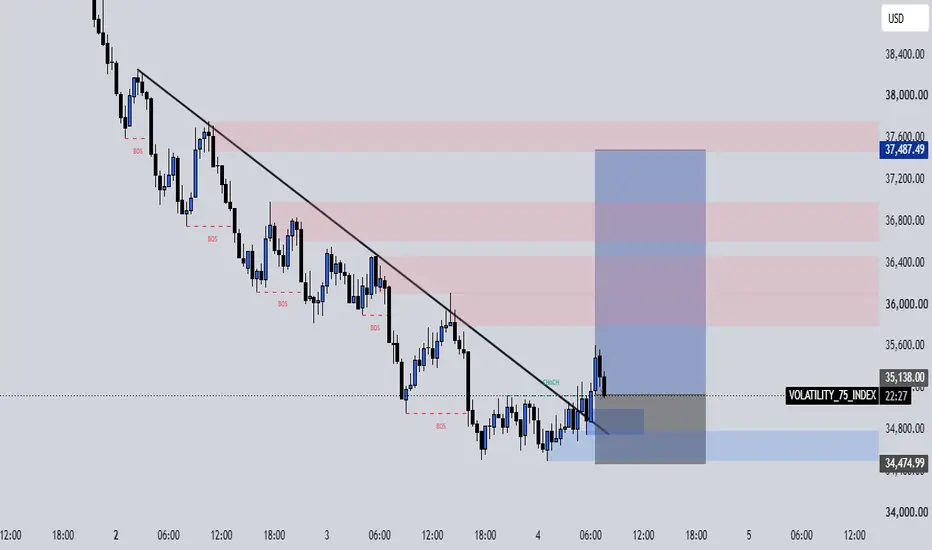
VOLATILITY 75 INDEX – BUY Analysis
1. Market Structure: The market was previously in a downtrend, forming Lower Highs and Lower Lows.
2. BOS (Break of Structure): Red BOS labels show where price broke previous support levels, confirming bearish momentum.
3. Trendline: The black descending trendline shows the previous bearish direction. Price later broke above it.
4. Supply Zones: Red areas represent potential selling zones where price may face resistance.
5. Demand Zone: The blue area represents a potential buying zone where buyers may enter.
6. CHoCH: The green CHoCH indicates a possible change from bearish to bullish market structure.
7. BUY Setup:
Entry: 35,138.00
Take Profit: 37,487.49
Stop Loss: 34,474.99
Conclusion: Price is showing signs of a bullish reversal after reacting to the demand zone and breaking the descending trendline. A BUY opportunity is possible, but always wait for confirmation and manage your risk.
1. Market Structure: The market was previously in a downtrend, forming Lower Highs and Lower Lows.
2. BOS (Break of Structure): Red BOS labels show where price broke previous support levels, confirming bearish momentum.
3. Trendline: The black descending trendline shows the previous bearish direction. Price later broke above it.
4. Supply Zones: Red areas represent potential selling zones where price may face resistance.
5. Demand Zone: The blue area represents a potential buying zone where buyers may enter.
6. CHoCH: The green CHoCH indicates a possible change from bearish to bullish market structure.
7. BUY Setup:
Entry: 35,138.00
Take Profit: 37,487.49
Stop Loss: 34,474.99
Conclusion: Price is showing signs of a bullish reversal after reacting to the demand zone and breaking the descending trendline. A BUY opportunity is possible, but always wait for confirmation and manage your risk.

Clause de non-responsabilité
Les informations et publications ne sont pas destinées à être, et ne constituent pas, des conseils ou recommandations financiers, d'investissement, de trading ou autres fournis ou approuvés par TradingView. Pour en savoir plus, consultez les Conditions d'utilisation.
Clause de non-responsabilité
Les informations et publications ne sont pas destinées à être, et ne constituent pas, des conseils ou recommandations financiers, d'investissement, de trading ou autres fournis ou approuvés par TradingView. Pour en savoir plus, consultez les Conditions d'utilisation.