Long
WAVES Double Bottom
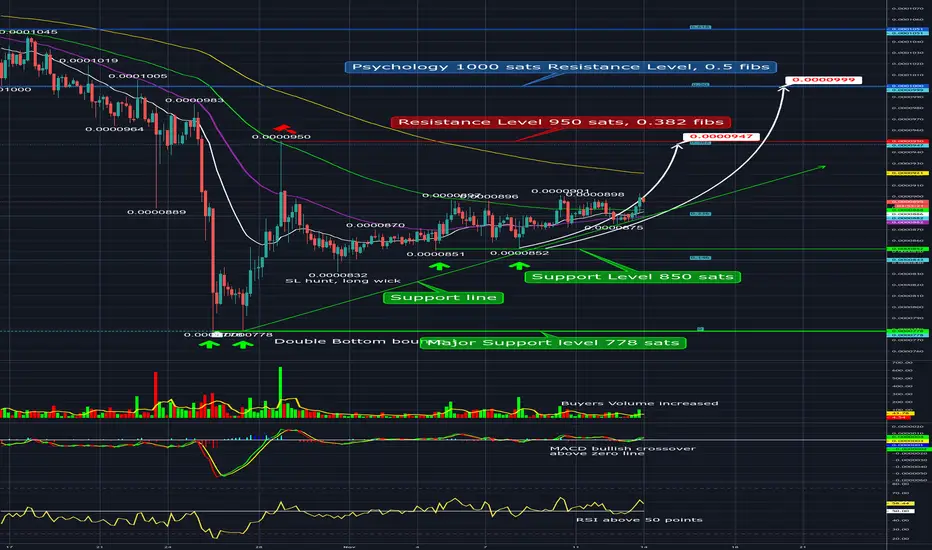
WAVES was farmed double bottom at 778 sats. Uptrend closed above EMA 21,50,100 periods. Potential retest EMA 200 at 921 sats and 0.382 fibs level 947 sats.
Was hold above green support line.
Volume: of buyers increased, confirm bullish price action.
Indicators: MACD bullish crossover above zero line. RSI above 50 points. Bullish sign.
Pattern: Double bottom at 778 sats.
S/R: Support at 850 sats, Major Support at 778 sat, Resistance at 950, Psychology Resistance 1000 sats, 0.618 sats Resistance at 1051.
Disclaimer: THIS IS NOT FINANCIAL ADVICE. All the information shared here is for learning and entertainment purposes only.

Clause de non-responsabilité
Les informations et publications ne sont pas destinées à être, et ne constituent pas, des conseils ou recommandations financiers, d'investissement, de trading ou autres fournis ou approuvés par TradingView. Pour en savoir plus, consultez les Conditions d'utilisation.
Clause de non-responsabilité
Les informations et publications ne sont pas destinées à être, et ne constituent pas, des conseils ou recommandations financiers, d'investissement, de trading ou autres fournis ou approuvés par TradingView. Pour en savoir plus, consultez les Conditions d'utilisation.