
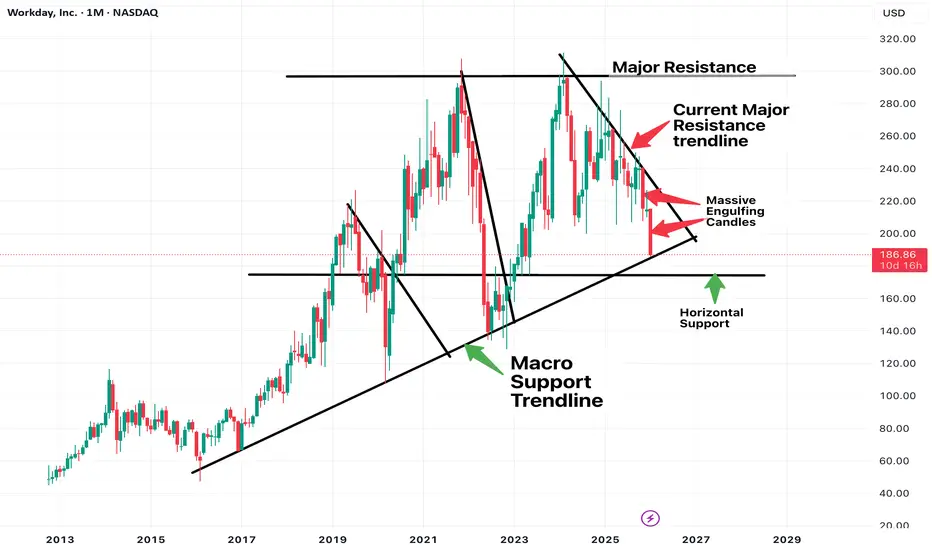
Workday (WDAY) recent price movements align with major macro signs for this stock.
This analysis is for educational purpose only.
We are on the 1 Month timeframe to get a macro assessment of this stock. Assessing the macro picture can really give us clues on long term trend direction allowing for better short term and long term trade setups.
Ive placed some trendlines pointing out in my opinion major Support and Resistance areas.
WDAY has been attempting to breakout of the $300.00 price point since November 2021.
Attempted again Feb 2024 and in December 2024 with a wick indicating weakness in the breakout attempt.
Since then we've had Price DECLINE or be pushed down by the "Current" Major Resistance Trendline.
Our January Candle currently is a Massive Engulfing Bearish Candle indicating Momentum and Strength for Price DECLINES.
This could indicate further declines even for the Month of February and something to consider.
Especially if we are trying to make sense of this current move and for how long downtrend may continue.
Note we are currently making contact with the Macro Trend Line, which is an extremely important trendline since price action has maintained this trendline since Feb 2016.
When you look back in history, everytime we have interacted, Price has went on UPTRENDS.
So this area is important to observe
Will it do the same this time? Or will we continue further down? Are important questions to ask.
Another area to watch is the Horizontal Support line that has been labeled. If the Macro trendline breaks, this is the second area price action will attempt to test support at.
Technical analysis is always about observing, assessing and waiting for confirmation. I would like to see January Monthly candle close on or above Macro Trendline and February to also maintain this Trendline.
If you start to see consecutive monthly closes below this trendline. It may indicate Trend change.
Look for more evidence within indicators, candle stick behavior, other timeframes and more to be posted as i continue to monitor WDAY.
This analysis is for educational purpose only.
We are on the 1 Month timeframe to get a macro assessment of this stock. Assessing the macro picture can really give us clues on long term trend direction allowing for better short term and long term trade setups.
Ive placed some trendlines pointing out in my opinion major Support and Resistance areas.
WDAY has been attempting to breakout of the $300.00 price point since November 2021.
Attempted again Feb 2024 and in December 2024 with a wick indicating weakness in the breakout attempt.
Since then we've had Price DECLINE or be pushed down by the "Current" Major Resistance Trendline.
Our January Candle currently is a Massive Engulfing Bearish Candle indicating Momentum and Strength for Price DECLINES.
This could indicate further declines even for the Month of February and something to consider.
Especially if we are trying to make sense of this current move and for how long downtrend may continue.
Note we are currently making contact with the Macro Trend Line, which is an extremely important trendline since price action has maintained this trendline since Feb 2016.
When you look back in history, everytime we have interacted, Price has went on UPTRENDS.
So this area is important to observe
Will it do the same this time? Or will we continue further down? Are important questions to ask.
Another area to watch is the Horizontal Support line that has been labeled. If the Macro trendline breaks, this is the second area price action will attempt to test support at.
Technical analysis is always about observing, assessing and waiting for confirmation. I would like to see January Monthly candle close on or above Macro Trendline and February to also maintain this Trendline.
If you start to see consecutive monthly closes below this trendline. It may indicate Trend change.
Look for more evidence within indicators, candle stick behavior, other timeframes and more to be posted as i continue to monitor WDAY.
Note
Zooming in on the 1 Week.
Some positive developments and signs exist.
Firstly, Last weeks Candle closed ABOVE Macro Support trendline.
Still early but if this weeks candle closes ABove as well. Very very solid sign.
With BULLISH momentum we can see an attempt back to test $226.00 ish area.
MACD is indicating potential waning Bearish momentum with the appearance of Pale red histogram bar and curving of the lines. But this would have to be observed at the end of trading day Friday. So very early.
Stoch RSI is also crossing Bullish BUT confirmation is when it gets ABOVE 20 level.
RSI seems to have held ABove the Blue line which indicates the last time we reached these levels in RSI which was June 2024. So after more than a Year we are down at lower levels of RSI.
QUite some developments and potential signs appearing, which will increase my attention on Workday moving forward with more updates soon.

Publications connexes
Clause de non-responsabilité
Les informations et publications ne sont pas destinées à être, et ne constituent pas, des conseils ou recommandations financiers, d'investissement, de trading ou autres fournis ou approuvés par TradingView. Pour en savoir plus, consultez les Conditions d'utilisation.
Publications connexes
Clause de non-responsabilité
Les informations et publications ne sont pas destinées à être, et ne constituent pas, des conseils ou recommandations financiers, d'investissement, de trading ou autres fournis ou approuvés par TradingView. Pour en savoir plus, consultez les Conditions d'utilisation.