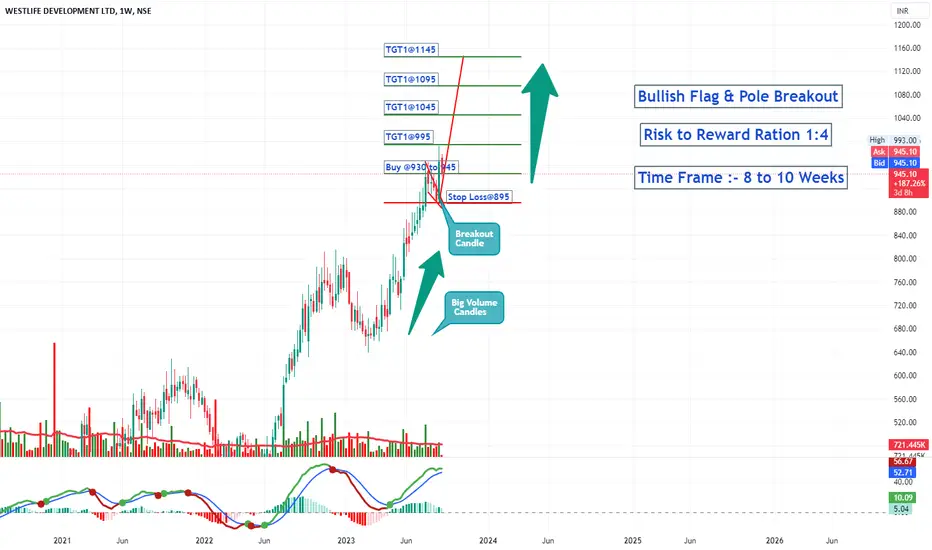
A Bullish Flag and Pole Chart Pattern Breakout happened on the weekly Time frame of  WESTLIFE
Price Action is well supported by the volume.
The stock is currently in uptrend making higher highs and higher lows.
One can add this stock into their stocks to buy list.
Initiate the long trade only according to the levels mentioned.
Stop loss will be on weekly closing basis.
Trend Analysis :- UP Trend
Chart Pattern :- Bullish Flag and Pole
Technical Indicator :- Positive MACD Crossover
WESTLIFE Price Action is well supported by the volume.
The stock is currently in uptrend making higher highs and higher lows.
One can add this stock into their stocks to buy list.
Initiate the long trade only according to the levels mentioned.
Stop loss will be on weekly closing basis.
Trend Analysis :- UP Trend
Chart Pattern :- Bullish Flag and Pole
Technical Indicator :- Positive MACD Crossover
Note
1st Target Achieved.....Enjoy the Money rain Guyssssssssssssssssss
Publications connexes
Clause de non-responsabilité
Les informations et publications ne sont pas destinées à être, et ne constituent pas, des conseils ou recommandations financiers, d'investissement, de trading ou autres fournis ou approuvés par TradingView. Pour en savoir plus, consultez les Conditions d'utilisation.