
Dear My friends,
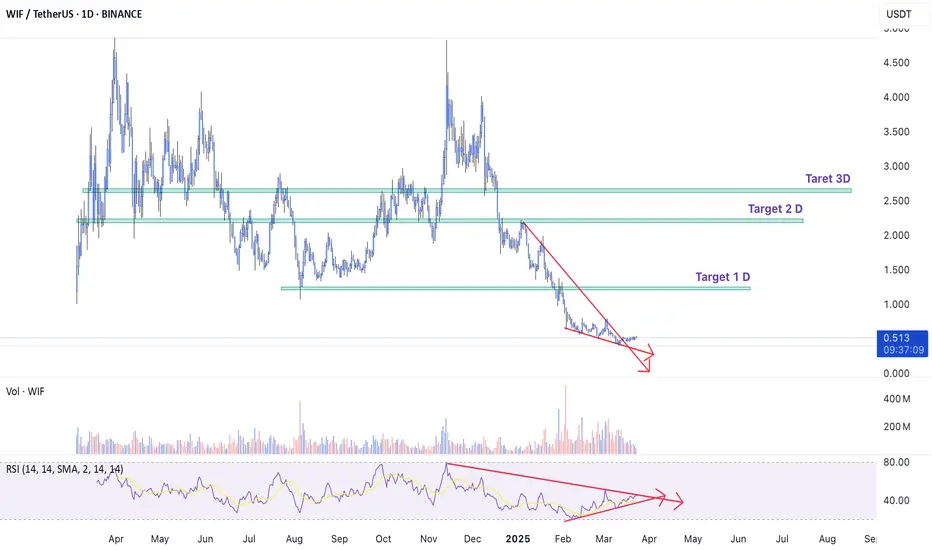
When looking at the WIF chart, I wonder, where is its bottom? The current price is even lower than when it was first listed on Binance. So, since I don’t know, I’ll just analyze it. And I’ll start from the bigger picture. When I zoom into the daily timeframe, everything seems clear to me. Take a look at the daily chart, and you’ll see that a divergence has appeared. The price is dropping, but the RSI indicator is rising. The price has broken out of the descending channel. Buying volume has been dominant in recent sessions. So, I’ve searched for target levels on the daily timeframe. I hope my analysis will help you, my friends.
Best Regards,
When looking at the WIF chart, I wonder, where is its bottom? The current price is even lower than when it was first listed on Binance. So, since I don’t know, I’ll just analyze it. And I’ll start from the bigger picture. When I zoom into the daily timeframe, everything seems clear to me. Take a look at the daily chart, and you’ll see that a divergence has appeared. The price is dropping, but the RSI indicator is rising. The price has broken out of the descending channel. Buying volume has been dominant in recent sessions. So, I’ve searched for target levels on the daily timeframe. I hope my analysis will help you, my friends.
Best Regards,

Publications connexes
Clause de non-responsabilité
Les informations et publications ne sont pas destinées à être, et ne constituent pas, des conseils ou recommandations financiers, d'investissement, de trading ou autres fournis ou approuvés par TradingView. Pour en savoir plus, consultez les Conditions d'utilisation.
Publications connexes
Clause de non-responsabilité
Les informations et publications ne sont pas destinées à être, et ne constituent pas, des conseils ou recommandations financiers, d'investissement, de trading ou autres fournis ou approuvés par TradingView. Pour en savoir plus, consultez les Conditions d'utilisation.