
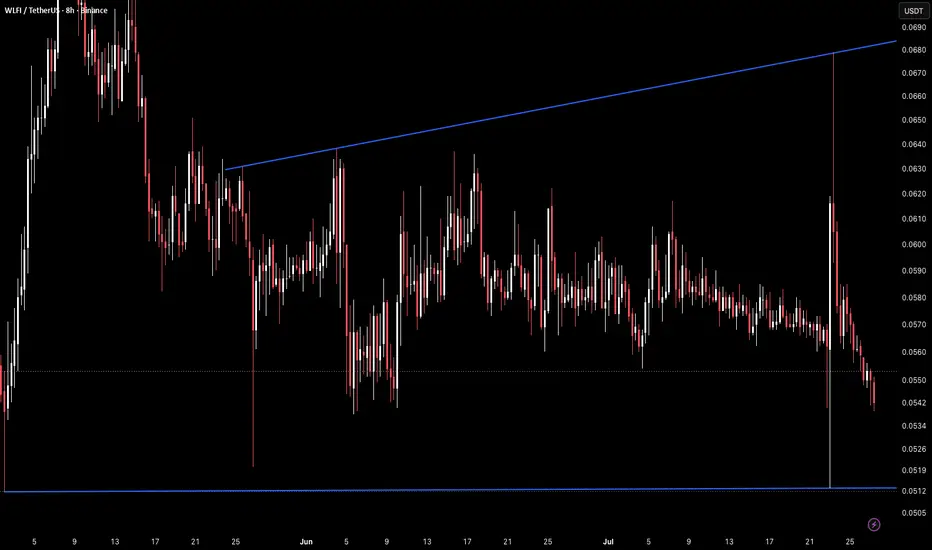
WLFI on the 8H timeframe is currently trading around 0.0542 after a sharp spike down on July 22 that pierced through the 0.0542–0.0546 horizontal support and briefly touched the macro horizontal floor near 0.0512–0.0515 before recovering, with price now sitting directly on the key support zone as the rising trendline climbs into the 0.0680 area far above.
The chart shows a rising trendline originating from the May low near 0.0512, connecting the June recovery high near 0.0636 and continuing to slope upward into the 0.0680 area currently, this trendline represents the upper boundary of the broader structure and sits well above current price. The macro horizontal floor near 0.0512–0.0515 has held as the lowest level on this chart since May and was briefly tested by the July 22 spike wick before price recovered back above it. Two horizontal reference levels define the current zone, one near 0.0542–0.0546 which has been a consistent floor since the June low, and a second near 0.0550–0.0555 just above it that acted as support through most of July before being lost in the current selloff. Price gapped below both levels on the July 22 spike and is now attempting to stabilize directly on the 0.0542–0.0546 zone with the macro floor near 0.0512–0.0515 as the last line beneath.
The July 22 spike was the sharpest single-candle move seen on this chart since the May bottom and brought price directly into the lowest support on the entire visible structure, making the current level the most critical test since inception.
Key Levels To Watch
→ 0.0820–0.0840 – All-time high region, major resistance above
→ 0.0636–0.0650 – Prior recovery high, resistance
→ 0.0598–0.0610 – Prior breakout zone, resistance
→ 0.0550–0.0555 – Broken horizontal support, now resistance
→ 0.0542–0.0546 – Horizontal support, current test
→ 0.0512–0.0515 – Macro horizontal floor, spike wick low
→ Below 0.0505 – Full macro breakdown, no visible support beneath
A hold above 0.0542–0.0546 and a recovery back through 0.0550–0.0555 would suggest the July 22 spike was a liquidity event rather than a structural break, reopening the path toward 0.0598–0.0610 and the prior breakout zone above.
A confirmed 8H close below 0.0542–0.0546 and a break of the macro floor near 0.0512–0.0515 would signal the most significant structural breakdown since the coin's launch on this chart, with no visible support beneath and downside entirely open below 0.0505.
Sharpest spike on this chart testing the deepest support since May. Hold 0.0542–0.0546 and reclaim 0.0550–0.0555 → spike was a liquidity event, recovery open toward 0.0598–0.0610. Lose 0.0512–0.0515 on confirmed close → full macro breakdown, open downside below 0.0505. Bias neutral to cautiously bullish at macro support. Shift bearish only on confirmed close below 0.0512–0.0515.
The chart shows a rising trendline originating from the May low near 0.0512, connecting the June recovery high near 0.0636 and continuing to slope upward into the 0.0680 area currently, this trendline represents the upper boundary of the broader structure and sits well above current price. The macro horizontal floor near 0.0512–0.0515 has held as the lowest level on this chart since May and was briefly tested by the July 22 spike wick before price recovered back above it. Two horizontal reference levels define the current zone, one near 0.0542–0.0546 which has been a consistent floor since the June low, and a second near 0.0550–0.0555 just above it that acted as support through most of July before being lost in the current selloff. Price gapped below both levels on the July 22 spike and is now attempting to stabilize directly on the 0.0542–0.0546 zone with the macro floor near 0.0512–0.0515 as the last line beneath.
The July 22 spike was the sharpest single-candle move seen on this chart since the May bottom and brought price directly into the lowest support on the entire visible structure, making the current level the most critical test since inception.
Key Levels To Watch
→ 0.0820–0.0840 – All-time high region, major resistance above
→ 0.0636–0.0650 – Prior recovery high, resistance
→ 0.0598–0.0610 – Prior breakout zone, resistance
→ 0.0550–0.0555 – Broken horizontal support, now resistance
→ 0.0542–0.0546 – Horizontal support, current test
→ 0.0512–0.0515 – Macro horizontal floor, spike wick low
→ Below 0.0505 – Full macro breakdown, no visible support beneath
A hold above 0.0542–0.0546 and a recovery back through 0.0550–0.0555 would suggest the July 22 spike was a liquidity event rather than a structural break, reopening the path toward 0.0598–0.0610 and the prior breakout zone above.
A confirmed 8H close below 0.0542–0.0546 and a break of the macro floor near 0.0512–0.0515 would signal the most significant structural breakdown since the coin's launch on this chart, with no visible support beneath and downside entirely open below 0.0505.
Sharpest spike on this chart testing the deepest support since May. Hold 0.0542–0.0546 and reclaim 0.0550–0.0555 → spike was a liquidity event, recovery open toward 0.0598–0.0610. Lose 0.0512–0.0515 on confirmed close → full macro breakdown, open downside below 0.0505. Bias neutral to cautiously bullish at macro support. Shift bearish only on confirmed close below 0.0512–0.0515.

Clause de non-responsabilité
Les informations et publications ne sont pas destinées à être, et ne constituent pas, des conseils ou recommandations financiers, d'investissement, de trading ou autres fournis ou approuvés par TradingView. Pour en savoir plus, consultez les Conditions d'utilisation.
Clause de non-responsabilité
Les informations et publications ne sont pas destinées à être, et ne constituent pas, des conseils ou recommandations financiers, d'investissement, de trading ou autres fournis ou approuvés par TradingView. Pour en savoir plus, consultez les Conditions d'utilisation.