
WTI Poised for a Rally? Key Support Hold Could Send Prices Skywa
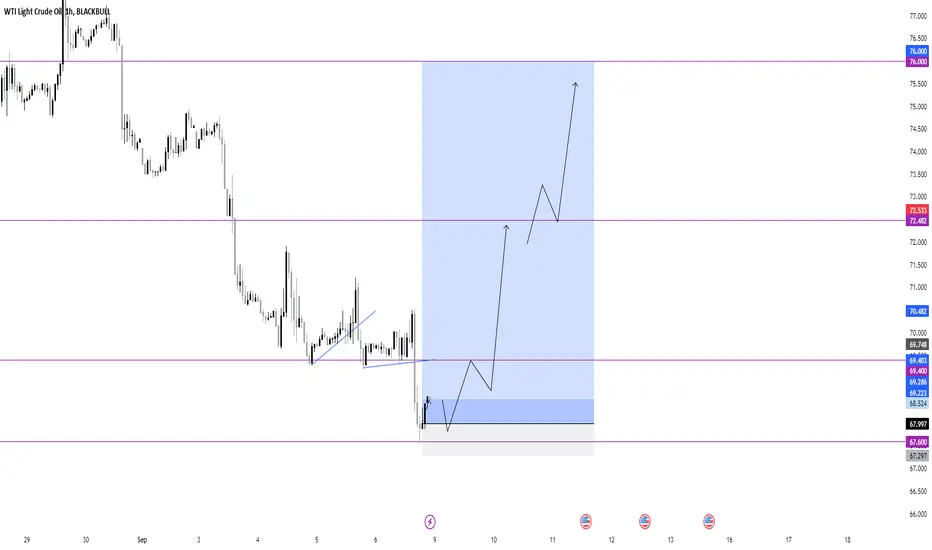
The chart indicates that WTI is approaching a critical support zone between $67.60 and $69.40, a level previously tested and held.
After forming a consolidation pattern, the price is likely to break upward, heading toward the next resistance at $72.50 and potentially extending to $76.00 if momentum builds.
A bullish move would be supported by the price remaining above the $69.40 area, indicating strong demand at these levels.
However, if this support breaks, there could be a further downward move towards $67.60.
The target zones to watch on the upside are $72.50 and $76.00, with significant resistance around those levels.
After forming a consolidation pattern, the price is likely to break upward, heading toward the next resistance at $72.50 and potentially extending to $76.00 if momentum builds.
A bullish move would be supported by the price remaining above the $69.40 area, indicating strong demand at these levels.
However, if this support breaks, there could be a further downward move towards $67.60.
The target zones to watch on the upside are $72.50 and $76.00, with significant resistance around those levels.

iSmashProfit
Publications connexes
Clause de non-responsabilité
Les informations et publications ne sont pas destinées à être, et ne constituent pas, des conseils ou recommandations financiers, d'investissement, de trading ou autres fournis ou approuvés par TradingView. Pour en savoir plus, consultez les Conditions d'utilisation.
iSmashProfit
Publications connexes
Clause de non-responsabilité
Les informations et publications ne sont pas destinées à être, et ne constituent pas, des conseils ou recommandations financiers, d'investissement, de trading ou autres fournis ou approuvés par TradingView. Pour en savoir plus, consultez les Conditions d'utilisation.