
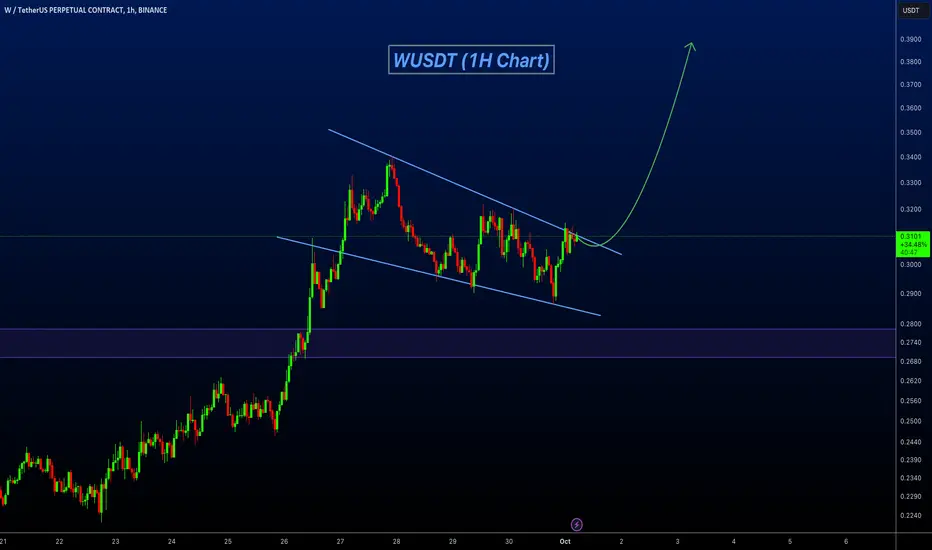
WUSDT technical analysis update
WUSDT has formed a bullish flag pattern on the 1-hour chart, and the price is now moving toward the flag resistance for a potential breakout. The price is currently trading above both the 100 and 200 EMA. Once the breakout is confirmed, we can expect a strong bullish move. Additionally, the price has already broken the double-bottom resistance on the daily chart and formed the flag pattern just above it.
WUSDT has formed a bullish flag pattern on the 1-hour chart, and the price is now moving toward the flag resistance for a potential breakout. The price is currently trading above both the 100 and 200 EMA. Once the breakout is confirmed, we can expect a strong bullish move. Additionally, the price has already broken the double-bottom resistance on the daily chart and formed the flag pattern just above it.

🚀Telegram : t.me/hexatrades
🌐Website: hexatrades.io/
🗣️Twitter(X): twitter.com/HexaTrades
🌐Website: hexatrades.io/
🗣️Twitter(X): twitter.com/HexaTrades
Publications connexes
Clause de non-responsabilité
Les informations et publications ne sont pas destinées à être, et ne constituent pas, des conseils ou recommandations financiers, d'investissement, de trading ou autres fournis ou approuvés par TradingView. Pour en savoir plus, consultez les Conditions d'utilisation.
🚀Telegram : t.me/hexatrades
🌐Website: hexatrades.io/
🗣️Twitter(X): twitter.com/HexaTrades
🌐Website: hexatrades.io/
🗣️Twitter(X): twitter.com/HexaTrades
Publications connexes
Clause de non-responsabilité
Les informations et publications ne sont pas destinées à être, et ne constituent pas, des conseils ou recommandations financiers, d'investissement, de trading ou autres fournis ou approuvés par TradingView. Pour en savoir plus, consultez les Conditions d'utilisation.