
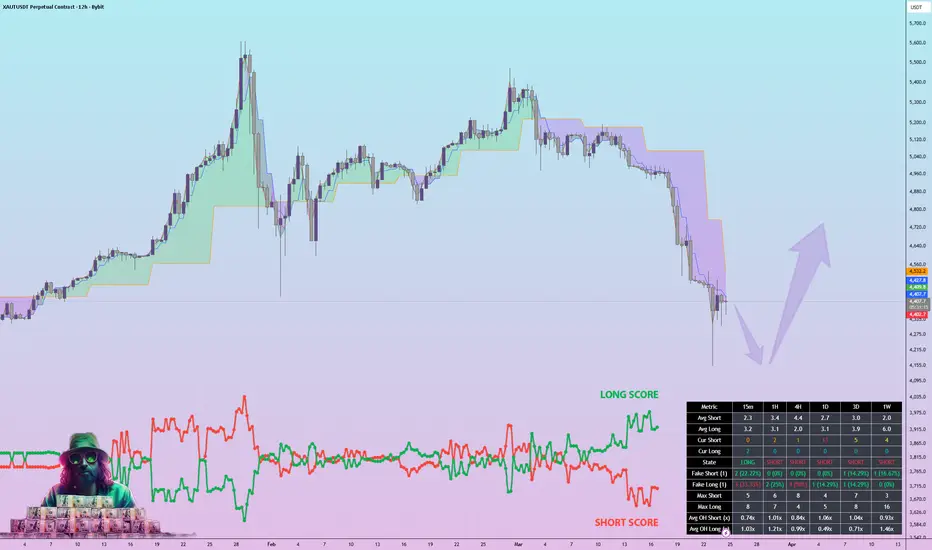
ALMA Long Add active: ~$4,350–$4,400 (24.03).
The March 16 XAUT long idea hit Hard SL. Closed -9.39%. XAUT kept falling — from $5,400 to $4,380, -19% total. The strategy is adding long again at the bottom. Score went from the initial setup to 58.8 — the highest reading in this series.
Here's the difference.
---
Score breakdown (58.8 total):
ALMA Overheat (Cur>Avg): 20.6
- 1D: 10.0 — 1D ALMA SHORT series at extreme length vs. average
- 1W: 6.0 — weekly ALMA SHORT overheat contributing
- 3D: 4.6 — 3D SHORT series also extended
Three timeframes simultaneously overheated. That's the setup. The 1D alone contributes more than the entire XMR score from March 19.
Deviation: 17.9

- 1D: 12.8 — price is ~13–15% below its 1D EMA. Not a small dip.
- 1H: 2.5, 3D: 2.5
The 1D deviation chart confirms it: the current 1D Dev% is at the highest reading in the entire dataset going back to December 2025. Price has never been this far from the 1D EMA during this gold run.
Series × 0.5: 2.5 — 1D and 4H contributing positively.
1st Bar Close: 2.5 — 1H confirmed below EMA on first bar.
SMC Class C: 0.8 — weak structure signal, honestly noted.
---
SMC / FVG (1D and 1W):

1D structure:
- MS CHoCH at $4,964.8 (15.03) — structure shifted bearish
- MS Trend Down confirmed at $4,964.8 (15.03)
- FVG Bull support floor: $4,025 (1D, major)
- Current price ~$4,380: sitting between MS Trend Down and first major support
- Overhead: FVG Bear zones stacked from $4,473 → $4,533 → $4,642 → $4,979–$5,007 → $5,026–$5,047

1W structure:
- MS BOS at $2,594.5 (Sept 2025) — weekly bullish pivot intact
- MS Trend Up at $3,364.0 (Apr 2025) — long-term structure bullish
- Weekly OB Bull zone: ~$3,800–$3,900 (deep but still active)
- The weekly trend has not broken. This is a correction inside a bull market, not a reversal.
Current price is holding above the 1D FVG Bull at $4,025. The question is whether it stabilizes here or tests the weekly OB.
---
Strategy mechanics (Long Only, 12H):
Entry condition: each 12H bar where ALMA signal = SHORT and (Cur S − Avg S) ≥ 1. Currently: Cur S=8, Avg S=4.1 → diff=3.9 — condition firmly met. Multiple adds active.
Position sizing: 25% of equity per bar. Max 4 adds (pyramiding=4) → up to 100% deployed.
Exit condition: ALMA signal = LONG and the subsequent LONG series becomes overheated: (Cur L − Avg L) ≥ 1. Strategy holds through the flip, exits when LONG phase is extended.
Hard stop: 10% from average entry price. The previous trade hit this level — that's what -9.39% was. Current adds are at lower prices, so the Hard SL level resets lower accordingly.
---
Context on the stop:
The March 16 idea entered at ~$4,800–$5,000. Hard SL at 10% = ~$4,320–$4,500. The selloff was sharp enough to trigger it. That's the cost of counter-trend averaging against a momentum move. Now the strategy re-enters at $4,380 — ~10% lower — with a 4× stronger score and the worst of the selling already priced in.
The Cur S charts tell the story: the short series is now at levels not seen in the entire 4-month data window. Every time this happened at lower magnitudes before, the ALMA Long averaged through it successfully. This is the most extreme reading to date.
12H ATR = 1.87%. 1D ATR = 3.25%. 3D ATR = 5.78%. Gold-backed token — lower volatility than pure crypto, but -19% moves happen.
The March 16 XAUT long idea hit Hard SL. Closed -9.39%. XAUT kept falling — from $5,400 to $4,380, -19% total. The strategy is adding long again at the bottom. Score went from the initial setup to 58.8 — the highest reading in this series.
Here's the difference.
---
Score breakdown (58.8 total):
ALMA Overheat (Cur>Avg): 20.6
- 1D: 10.0 — 1D ALMA SHORT series at extreme length vs. average
- 1W: 6.0 — weekly ALMA SHORT overheat contributing
- 3D: 4.6 — 3D SHORT series also extended
Three timeframes simultaneously overheated. That's the setup. The 1D alone contributes more than the entire XMR score from March 19.
Deviation: 17.9
- 1D: 12.8 — price is ~13–15% below its 1D EMA. Not a small dip.
- 1H: 2.5, 3D: 2.5
The 1D deviation chart confirms it: the current 1D Dev% is at the highest reading in the entire dataset going back to December 2025. Price has never been this far from the 1D EMA during this gold run.
Series × 0.5: 2.5 — 1D and 4H contributing positively.
1st Bar Close: 2.5 — 1H confirmed below EMA on first bar.
SMC Class C: 0.8 — weak structure signal, honestly noted.
---
SMC / FVG (1D and 1W):
1D structure:
- MS CHoCH at $4,964.8 (15.03) — structure shifted bearish
- MS Trend Down confirmed at $4,964.8 (15.03)
- FVG Bull support floor: $4,025 (1D, major)
- Current price ~$4,380: sitting between MS Trend Down and first major support
- Overhead: FVG Bear zones stacked from $4,473 → $4,533 → $4,642 → $4,979–$5,007 → $5,026–$5,047
1W structure:
- MS BOS at $2,594.5 (Sept 2025) — weekly bullish pivot intact
- MS Trend Up at $3,364.0 (Apr 2025) — long-term structure bullish
- Weekly OB Bull zone: ~$3,800–$3,900 (deep but still active)
- The weekly trend has not broken. This is a correction inside a bull market, not a reversal.
Current price is holding above the 1D FVG Bull at $4,025. The question is whether it stabilizes here or tests the weekly OB.
---
Strategy mechanics (Long Only, 12H):
Entry condition: each 12H bar where ALMA signal = SHORT and (Cur S − Avg S) ≥ 1. Currently: Cur S=8, Avg S=4.1 → diff=3.9 — condition firmly met. Multiple adds active.
Position sizing: 25% of equity per bar. Max 4 adds (pyramiding=4) → up to 100% deployed.
Exit condition: ALMA signal = LONG and the subsequent LONG series becomes overheated: (Cur L − Avg L) ≥ 1. Strategy holds through the flip, exits when LONG phase is extended.
Hard stop: 10% from average entry price. The previous trade hit this level — that's what -9.39% was. Current adds are at lower prices, so the Hard SL level resets lower accordingly.
---
Context on the stop:
The March 16 idea entered at ~$4,800–$5,000. Hard SL at 10% = ~$4,320–$4,500. The selloff was sharp enough to trigger it. That's the cost of counter-trend averaging against a momentum move. Now the strategy re-enters at $4,380 — ~10% lower — with a 4× stronger score and the worst of the selling already priced in.
The Cur S charts tell the story: the short series is now at levels not seen in the entire 4-month data window. Every time this happened at lower magnitudes before, the ALMA Long averaged through it successfully. This is the most extreme reading to date.
12H ATR = 1.87%. 1D ATR = 3.25%. 3D ATR = 5.78%. Gold-backed token — lower volatility than pure crypto, but -19% moves happen.

BoaBias / Goldfinch_song
Swing trader · bar-close systematic book
800+ TRADES · WR 60% · AVG HOLD 7D · AVG PNL 7% · MAX DD -3.4%
CRYPTO · STOCKS · INDICES · METALS
📈Sharing Ideas · indicators · strategies with honest stats · Educational only NFA
Swing trader · bar-close systematic book
800+ TRADES · WR 60% · AVG HOLD 7D · AVG PNL 7% · MAX DD -3.4%
CRYPTO · STOCKS · INDICES · METALS
📈Sharing Ideas · indicators · strategies with honest stats · Educational only NFA
Publications connexes
Clause de non-responsabilité
Les informations et publications ne sont pas destinées à être, et ne constituent pas, des conseils ou recommandations financiers, d'investissement, de trading ou autres fournis ou approuvés par TradingView. Pour en savoir plus, consultez les Conditions d'utilisation.
BoaBias / Goldfinch_song
Swing trader · bar-close systematic book
800+ TRADES · WR 60% · AVG HOLD 7D · AVG PNL 7% · MAX DD -3.4%
CRYPTO · STOCKS · INDICES · METALS
📈Sharing Ideas · indicators · strategies with honest stats · Educational only NFA
Swing trader · bar-close systematic book
800+ TRADES · WR 60% · AVG HOLD 7D · AVG PNL 7% · MAX DD -3.4%
CRYPTO · STOCKS · INDICES · METALS
📈Sharing Ideas · indicators · strategies with honest stats · Educational only NFA
Publications connexes
Clause de non-responsabilité
Les informations et publications ne sont pas destinées à être, et ne constituent pas, des conseils ou recommandations financiers, d'investissement, de trading ou autres fournis ou approuvés par TradingView. Pour en savoir plus, consultez les Conditions d'utilisation.