
Hey all,
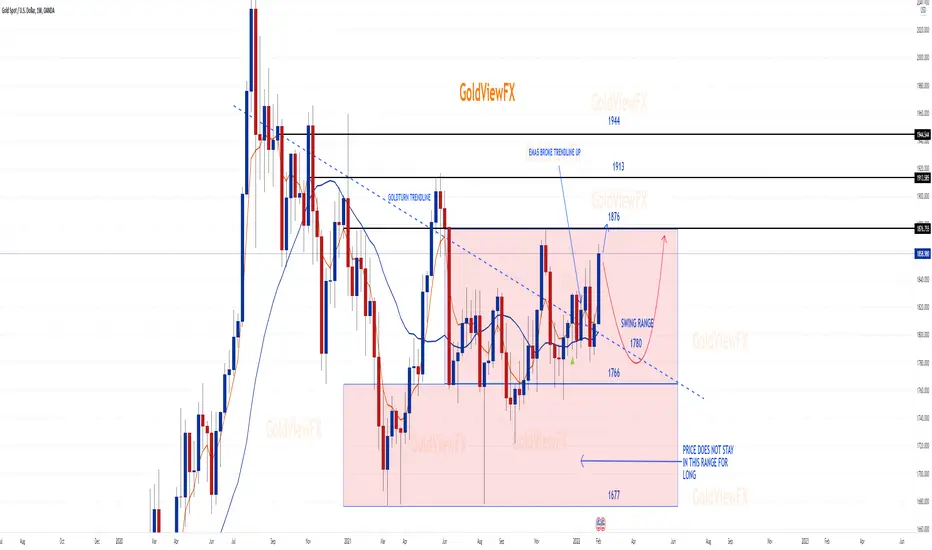
Weekly chart looks very Bullish with the Goldturn trendline broken to the upside opening target to 1876 and with enough momentum in that range will easily take out the upper targets.
1766 is the lowest of the range we can see over the coming months and any deeper price drops can go as low as 1677. Price does not seem to stay in this low range for long and historically weekly candles wick out. Its worth noting this if we end up in this range in the coming weeks/month to avoid getting sells stuck, as we can see from historical movements, it can leave the range very quickly.
Please don't forget to like, comment and follow to support our work, we really appreciate it!
GoldViewFX
XAUUSD TOP AUTHOR
Weekly chart looks very Bullish with the Goldturn trendline broken to the upside opening target to 1876 and with enough momentum in that range will easily take out the upper targets.
1766 is the lowest of the range we can see over the coming months and any deeper price drops can go as low as 1677. Price does not seem to stay in this low range for long and historically weekly candles wick out. Its worth noting this if we end up in this range in the coming weeks/month to avoid getting sells stuck, as we can see from historical movements, it can leave the range very quickly.
Please don't forget to like, comment and follow to support our work, we really appreciate it!
GoldViewFX
XAUUSD TOP AUTHOR

🪙 JOIN OUR FREE TELEGRAM GROUP 🪙 t.me/GoldView_FX
🪙 JOIN OUR DISCORD FOR BACKUP 🪙
discord.com/invite/9ZrEHGuaE2
We never DM first
🏆MESSAGE US FOR VIP SIGNALS🏆
t.me/GoldviewFX
or
email goldviewfx@gmail com
🪙 JOIN OUR DISCORD FOR BACKUP 🪙
discord.com/invite/9ZrEHGuaE2
We never DM first
🏆MESSAGE US FOR VIP SIGNALS🏆
t.me/GoldviewFX
or
email goldviewfx@gmail com
Publications connexes
Clause de non-responsabilité
Les informations et publications ne sont pas destinées à être, et ne constituent pas, des conseils ou recommandations financiers, d'investissement, de trading ou autres fournis ou approuvés par TradingView. Pour en savoir plus, consultez les Conditions d'utilisation.
🪙 JOIN OUR FREE TELEGRAM GROUP 🪙 t.me/GoldView_FX
🪙 JOIN OUR DISCORD FOR BACKUP 🪙
discord.com/invite/9ZrEHGuaE2
We never DM first
🏆MESSAGE US FOR VIP SIGNALS🏆
t.me/GoldviewFX
or
email goldviewfx@gmail com
🪙 JOIN OUR DISCORD FOR BACKUP 🪙
discord.com/invite/9ZrEHGuaE2
We never DM first
🏆MESSAGE US FOR VIP SIGNALS🏆
t.me/GoldviewFX
or
email goldviewfx@gmail com
Publications connexes
Clause de non-responsabilité
Les informations et publications ne sont pas destinées à être, et ne constituent pas, des conseils ou recommandations financiers, d'investissement, de trading ou autres fournis ou approuvés par TradingView. Pour en savoir plus, consultez les Conditions d'utilisation.