
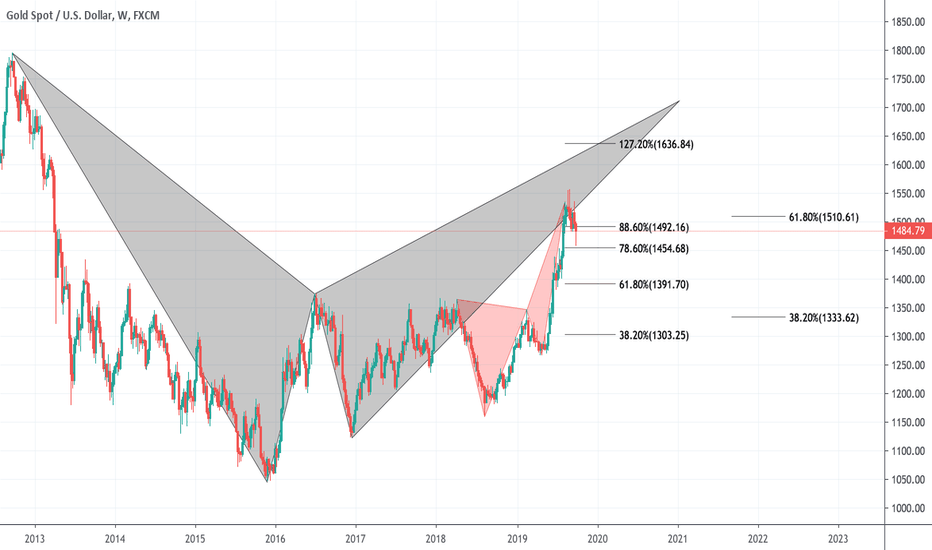
Lets start off with taking a look back at this chart from October 2019:
Heres how the weekly chart currenty looks:

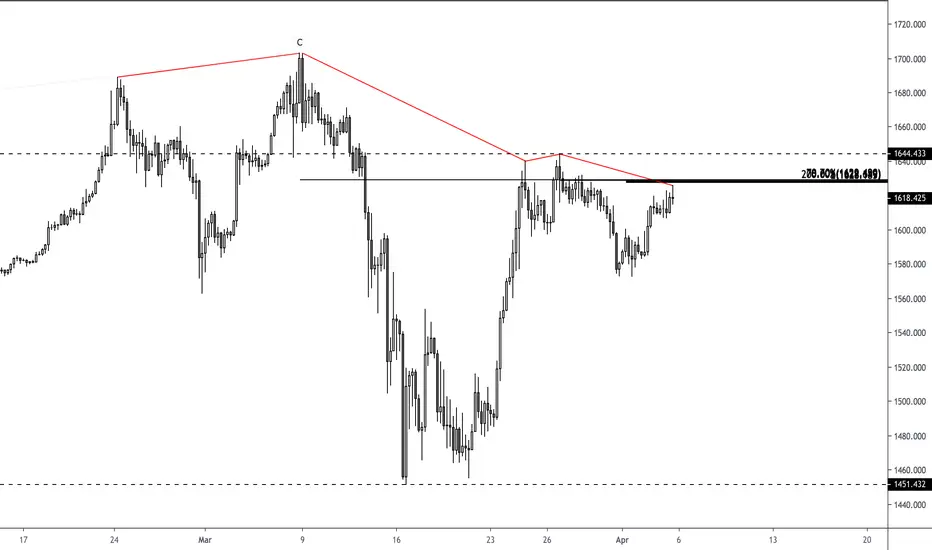
On the 4h timeframe red trendlines highlights both regular and hidden divergences appearing all over this market. ''C'' is a 261.8% extension that was followed by a 15% decline! Considering the huge drop, im expecting this trend to continue and another dip in this market is anticipated.
A trade with stops above the highs targeting the lows would not be a bad idea IMO.
Whats your view on XAU/USD?
Share your comments in the section below
Thank you for reading
Heres how the weekly chart currenty looks:
On the 4h timeframe red trendlines highlights both regular and hidden divergences appearing all over this market. ''C'' is a 261.8% extension that was followed by a 15% decline! Considering the huge drop, im expecting this trend to continue and another dip in this market is anticipated.
A trade with stops above the highs targeting the lows would not be a bad idea IMO.
Whats your view on XAU/USD?
Share your comments in the section below
Thank you for reading
Note
A break below the trendline indicates a shift in momentum:
Clause de non-responsabilité
Les informations et publications ne sont pas destinées à être, et ne constituent pas, des conseils ou recommandations financiers, d'investissement, de trading ou autres fournis ou approuvés par TradingView. Pour en savoir plus, consultez les Conditions d'utilisation.
Clause de non-responsabilité
Les informations et publications ne sont pas destinées à être, et ne constituent pas, des conseils ou recommandations financiers, d'investissement, de trading ou autres fournis ou approuvés par TradingView. Pour en savoir plus, consultez les Conditions d'utilisation.