
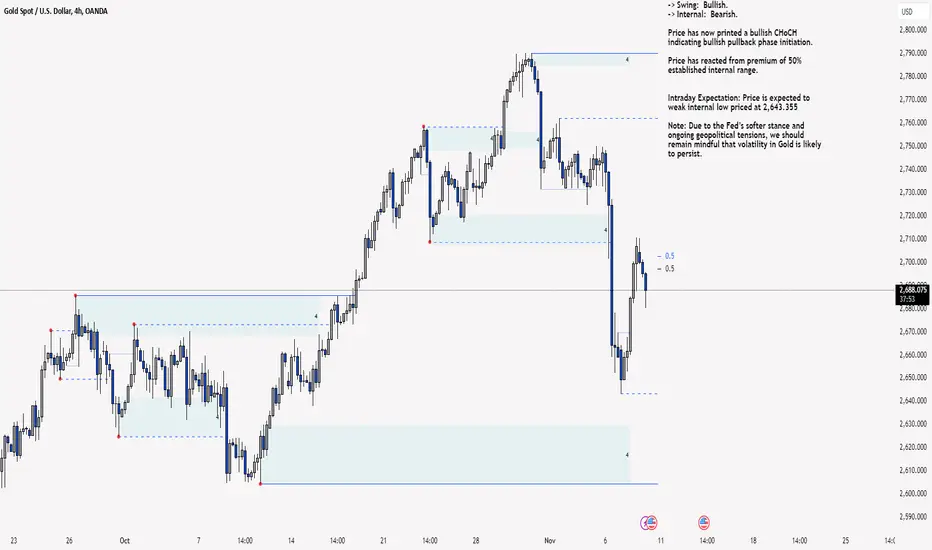
H4 Analysis:
-> Swing: Bullish.
-> Internal: Bearish.
Price has now printed a bullish CHoCH indicating bullish pullback phase initiation.
Price has reacted from premium of 50% established internal range.
Intraday Expectation: Price is expected to weak internal low priced at 2,643.355
Note: Due to the Fed’s softer stance and ongoing geopolitical tensions, we should remain mindful that volatility in Gold is likely to persist.
H4 Chart:
M15 Analysis:
-> Swing: Bullish.
-> Internal: Bullish.
Price Action Analysis: Price has printed a bullish iBOS followed by a bearish CHoCH, indicating the initiation of a bearish pullback phase.
Intraday Expectation: Technically, price is expected to react from either the discount of 50% internal equilibrium level (EQ) or the M15 demand zone before targeting the weak internal high.
Alternative Scenario: Given that the H4 timeframe is in a bullish pullback phase, it's no surprise that the M15 chart has printed a bullish iBOS. However, with H4 price trading up to premium of 50% internal EQ and reacting from that premium zone, it wouldn’t be surprising if the price prints a bearish iBOS.
Note: With the Fed's softer policy stance and escalating geopolitical tensions, elevated price volatility is likely to persist.
M15 Chart:
-> Swing: Bullish.
-> Internal: Bearish.
Price has now printed a bullish CHoCH indicating bullish pullback phase initiation.
Price has reacted from premium of 50% established internal range.
Intraday Expectation: Price is expected to weak internal low priced at 2,643.355
Note: Due to the Fed’s softer stance and ongoing geopolitical tensions, we should remain mindful that volatility in Gold is likely to persist.
H4 Chart:
M15 Analysis:
-> Swing: Bullish.
-> Internal: Bullish.
Price Action Analysis: Price has printed a bullish iBOS followed by a bearish CHoCH, indicating the initiation of a bearish pullback phase.
Intraday Expectation: Technically, price is expected to react from either the discount of 50% internal equilibrium level (EQ) or the M15 demand zone before targeting the weak internal high.
Alternative Scenario: Given that the H4 timeframe is in a bullish pullback phase, it's no surprise that the M15 chart has printed a bullish iBOS. However, with H4 price trading up to premium of 50% internal EQ and reacting from that premium zone, it wouldn’t be surprising if the price prints a bearish iBOS.
Note: With the Fed's softer policy stance and escalating geopolitical tensions, elevated price volatility is likely to persist.
M15 Chart:

Publications connexes
Clause de non-responsabilité
Les informations et publications ne sont pas destinées à être, et ne constituent pas, des conseils ou recommandations financiers, d'investissement, de trading ou autres fournis ou approuvés par TradingView. Pour en savoir plus, consultez les Conditions d'utilisation.
Publications connexes
Clause de non-responsabilité
Les informations et publications ne sont pas destinées à être, et ne constituent pas, des conseils ou recommandations financiers, d'investissement, de trading ou autres fournis ou approuvés par TradingView. Pour en savoir plus, consultez les Conditions d'utilisation.