
Hi!
It’s clear we are witnessing a historic technical expansion. This isn't just a short-term rally; we are deep within a multi-decade Elliot Wave structure that suggests the "real" move is only just beginning.
The Macro Elliot Wave Count
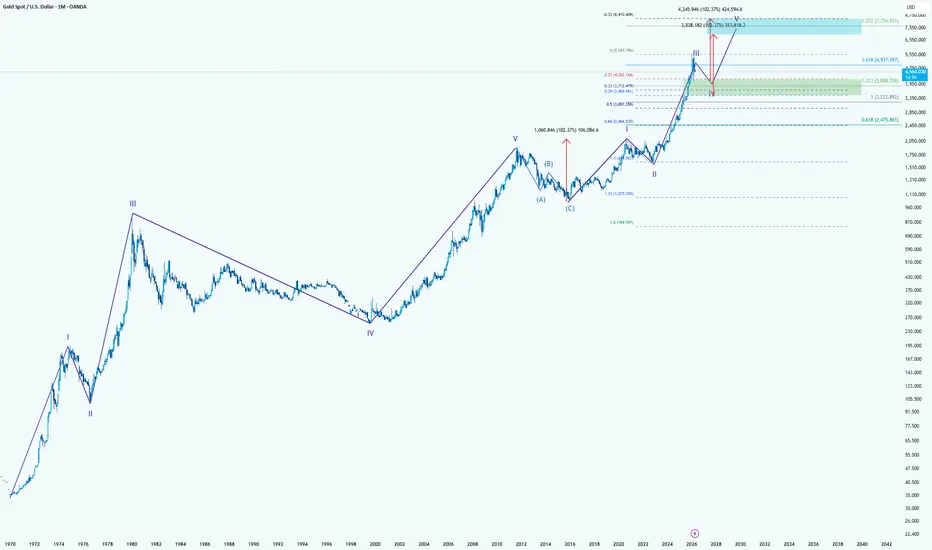
The structural integrity of this chart is remarkable. After completing a massive 5-wave impulse into the 2011 high (Wave V), Gold entered a prolonged ABC corrective phase. Since the 2016 lows, the market has transitioned into a new, even larger impulse cycle.
The Current Position: We are currently navigating Wave III of this massive move. As any seasoned trader knows, the third wave is typically the longest and most powerful.
Fibonacci Confluence: The price action is perfectly respecting the Fibonacci expansion levels. We’ve seen a clean break above the 1.272 extension ($4,099), which has now flipped from a ceiling into a massive structural floor.
The Road to Wave V
The internal sub-waves are painting a very bullish picture for the next decade. Following the current localized correction (Wave IV), the projection points toward a final explosive Wave V.
Strategic Outlook
While the long-term trajectory is vertical, expect volatility at these elevated levels. The green support zone around $3,800 is the critical "must-hold" area to keep this specific wave count valid. As long as Gold stays above this base, the technical path toward $7,700 is effectively wide open. We are essentially watching the repricing of Gold in real-time as it breaks away from historical norms.
It’s clear we are witnessing a historic technical expansion. This isn't just a short-term rally; we are deep within a multi-decade Elliot Wave structure that suggests the "real" move is only just beginning.
The Macro Elliot Wave Count
The structural integrity of this chart is remarkable. After completing a massive 5-wave impulse into the 2011 high (Wave V), Gold entered a prolonged ABC corrective phase. Since the 2016 lows, the market has transitioned into a new, even larger impulse cycle.
The Current Position: We are currently navigating Wave III of this massive move. As any seasoned trader knows, the third wave is typically the longest and most powerful.
Fibonacci Confluence: The price action is perfectly respecting the Fibonacci expansion levels. We’ve seen a clean break above the 1.272 extension ($4,099), which has now flipped from a ceiling into a massive structural floor.
The Road to Wave V
The internal sub-waves are painting a very bullish picture for the next decade. Following the current localized correction (Wave IV), the projection points toward a final explosive Wave V.
- Target (The Supercycle Peak): Based on the measured move and the 2.272 extension, the ultimate target for this grand cycle sits between $7,750 and $8,400.
Strategic Outlook
While the long-term trajectory is vertical, expect volatility at these elevated levels. The green support zone around $3,800 is the critical "must-hold" area to keep this specific wave count valid. As long as Gold stays above this base, the technical path toward $7,700 is effectively wide open. We are essentially watching the repricing of Gold in real-time as it breaks away from historical norms.

🟢 Telegram channel: t.me/melikatrader94
🔴 Forex channel: t.me/melikatrader94GoldForex
🟢 ADX & DFM channel: t.me/ADXandDFM
🔴 Forex channel: t.me/melikatrader94GoldForex
🟢 ADX & DFM channel: t.me/ADXandDFM
Publications connexes
Clause de non-responsabilité
Les informations et publications ne sont pas destinées à être, et ne constituent pas, des conseils ou recommandations financiers, d'investissement, de trading ou autres fournis ou approuvés par TradingView. Pour en savoir plus, consultez les Conditions d'utilisation.
🟢 Telegram channel: t.me/melikatrader94
🔴 Forex channel: t.me/melikatrader94GoldForex
🟢 ADX & DFM channel: t.me/ADXandDFM
🔴 Forex channel: t.me/melikatrader94GoldForex
🟢 ADX & DFM channel: t.me/ADXandDFM
Publications connexes
Clause de non-responsabilité
Les informations et publications ne sont pas destinées à être, et ne constituent pas, des conseils ou recommandations financiers, d'investissement, de trading ou autres fournis ou approuvés par TradingView. Pour en savoir plus, consultez les Conditions d'utilisation.