
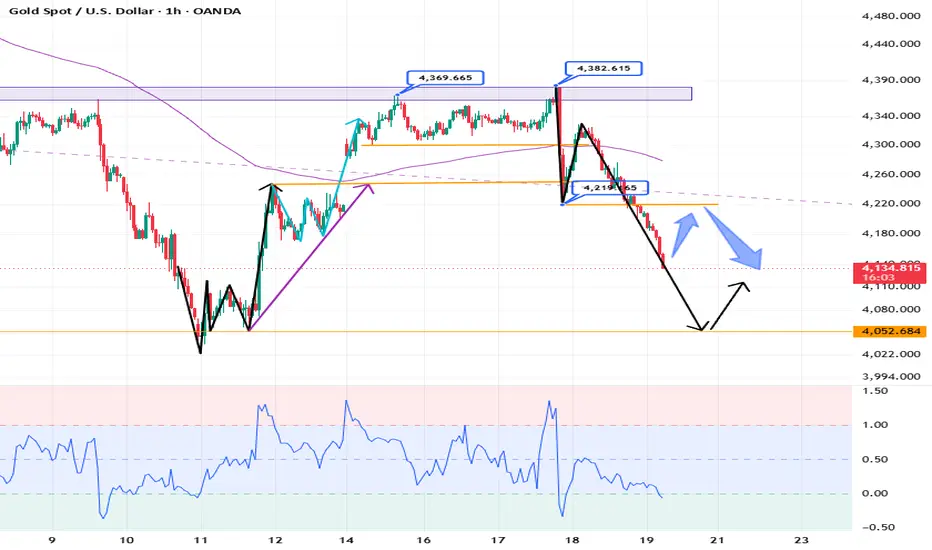
Gold prices suffered a significant setback, experiencing a sharp decline on the daily chart, falling $240 from around 4380 to approximately 4140. The daily chart shows a continuous decline, with the 10-day and 7-day moving averages maintaining a death cross and widening downwards. The RSI indicator is below the midline, and the price remains within the lower Bollinger Bands.
On the hourly and 4-hour charts, the Bollinger Bands are widening downwards, and the moving averages have also formed a death cross and are widening downwards. Yesterday's sharp drop in gold prices, breaking below the 4200 level again, has established a very strong bearish trend. Today's trading strategy is primarily to sell on rallies, anticipating an initial decline followed by a rise, and then another decline.
My recommendations:
BUY: 4060-4070, SL: 4040, TP: 4130-4160;
SELL: 4200-4210, SL: 4230, SL: 4140-4100;
On the hourly and 4-hour charts, the Bollinger Bands are widening downwards, and the moving averages have also formed a death cross and are widening downwards. Yesterday's sharp drop in gold prices, breaking below the 4200 level again, has established a very strong bearish trend. Today's trading strategy is primarily to sell on rallies, anticipating an initial decline followed by a rise, and then another decline.
My recommendations:
BUY: 4060-4070, SL: 4040, TP: 4130-4160;
SELL: 4200-4210, SL: 4230, SL: 4140-4100;

💥 Full-time finance professional.
💥More than 11 years of experience in gold trading
⬇️I will guide you to profitability.
My Telegram : t.me/JungoldAnalyst
💥More than 11 years of experience in gold trading
⬇️I will guide you to profitability.
My Telegram : t.me/JungoldAnalyst
Clause de non-responsabilité
Les informations et publications ne sont pas destinées à être, et ne constituent pas, des conseils ou recommandations financiers, d'investissement, de trading ou autres fournis ou approuvés par TradingView. Pour en savoir plus, consultez les Conditions d'utilisation.
💥 Full-time finance professional.
💥More than 11 years of experience in gold trading
⬇️I will guide you to profitability.
My Telegram : t.me/JungoldAnalyst
💥More than 11 years of experience in gold trading
⬇️I will guide you to profitability.
My Telegram : t.me/JungoldAnalyst
Clause de non-responsabilité
Les informations et publications ne sont pas destinées à être, et ne constituent pas, des conseils ou recommandations financiers, d'investissement, de trading ou autres fournis ou approuvés par TradingView. Pour en savoir plus, consultez les Conditions d'utilisation.