
● The Conceptual Origin: Unveiling Twiggs Money Flow
The financial markets are fundamentally an arena of auction mechanics, where the invisible hand of liquidity dictates every structural shift in price. In the pursuit of deciphering these capital movements, technical analysis has long relied on volume as the primary forensic evidence of institutional participation. Historically, the Accumulation/Distribution line and its derivative, the Chaikin Money Flow (CMF), served as the standard barometers for buying and selling pressure. However, standard analytical constructs often possess inherent structural flaws that render them vulnerable to market noise, artificial volatility, and sudden liquidity gaps. Recognizing these mathematical vulnerabilities, Colin Twiggs engineered a highly sophisticated evolution of the Chaikin Money Flow, an oscillator that would come to be known as the Twiggs Money Flow (TMF).
At its core, the genesis of Twiggs Money Flow represents a critical leap from retail-grade observation to institutional-grade volume forensics. The conceptual origin of TMF is rooted in two significant adjustments to standard volume theory: the integration of True Range and the application of exponential smoothing. Traditional money flow indicators calculate the Close Location Value based strictly on the daily high and low, entirely ignoring the reality of overnight gaps. When a market gaps significantly—a frequent occurrence in volatile equities or during major macroeconomic releases—traditional indicators become blind to the true distance price has traveled. By substituting the standard daily range with True Range, TMF effectively captures the gap, acknowledging that the previous day's close is a vital anchor point for current liquidity dynamics.
Furthermore, Twiggs recognized that simple moving averages and cumulative sums create a "drop-off" distortion. When an exceptionally high volume day finally exits the lookback window of a simple average, the indicator line can spike or plunge violently, producing a false signal that has nothing to do with current market dynamics. To eliminate this lagging artifact, Twiggs applied Welles Wilder's method of exponential smoothing, ensuring that older data decays organically rather than falling off a cliff. This elegant mathematical refinement aligns seamlessly with Wyckoff theory and Smart Money Concepts (SMC), allowing quantitative developers and discretionary analysts to track stealth accumulation and distribution with unparalleled fidelity. By refining the inputs, TMF provides a crystalline view of money flow, serving as the heartbeat monitor for underlying institutional conviction.
● Narrative Technical Analysis: Deciphering the Microstructure
To truly leverage the power of Twiggs Money Flow, one must move beyond superficial overbought or oversold paradigms and understand the narrative of price microstructure that the indicator translates. The mechanics of TMF are best understood as a continuous evaluation of where the closing price settles relative to the absolute extremes of market action. In any given session, the battle between buyers and sellers culminates at the closing bell. If the close is situated near the True High, the algorithm interprets the session's volume as predominantly bullish, allocating a positive weight to that volume. Conversely, if the close is anchored near the True Low, the volume is classified as bearish distribution.
The precise location of the close determines the exact fractional weighting applied to the volume, meaning a close exactly at the midpoint of the True Range registers as entirely neutral, contributing zero directional pressure to the oscillator. This weighted volume is then subjected to Wilder's exponential smoothing, creating a dynamic moving average of accumulation or distribution. Simultaneously, the raw total volume is subjected to the same exponential smoothing process. The final oscillator value is simply the ratio of these two smoothed metrics, bound mathematically as a percentage that oscillates above and below a central zero line.
When observing the TMF visually, the zero line represents the absolute equilibrium of market forces. A sustained journey into positive territory dictates that capital is actively entering the asset, providing the necessary hydrostatic pressure to lift prices higher. A persistent negative reading warns that smart money is quietly offloading inventory, often while retail participants are blindly buying the dip. One of the most profound narrative signals generated by TMF is the divergence sequence. When price action prints a higher high, but the TMF prints a lower high, it is a structural anomaly indicating that the upward momentum is devoid of supporting volume; the buying pressure is exhausted, and a reversal is imminent. Conversely, a bullish divergence, where price achieves a lower low while TMF forms a higher low, reveals that the downward thrust is occurring on dwindling selling pressure, often signaling a stealth accumulation phase. Because TMF relies on exponential smoothing rather than strict cumulative totals, its trajectory is exceptionally fluid, filtering out the chaotic intraday noise and presenting a pure, unadulterated narrative of the prevailing liquidity trend.
● Institutional vs. Retail Perspective: The Liquidity Divide
The dichotomy between retail speculation and institutional execution is starkly illuminated through the lens of volume analysis. Retail traders, often equipped with rudimentary tools and surface-level knowledge, typically interpret volume through simplistic vertical bars or standard CMF outputs. They are frequently victimized by gap traps, buying aggressively after a massive morning gap up, unaware that the true range distribution indicates heavy institutional selling into their buying pressure. Institutions, hedge funds, and sophisticated quantitative desks operate in a different reality entirely. They require tools that accurately measure true market participation across multiple sessions, untainted by the mathematical glitches of simple moving averages.
For the institutional quantitative developer, indicators like Twiggs Money Flow are rarely used as standalone discretionary signals; they are foundational data points ingested into complex algorithmic engines. In the modern landscape of high-frequency and algorithmic trading, robust logic protection is paramount. Proprietary scripts and trading models utilizing advanced metrics like TMF are strictly guarded through licensing and logic protection mechanisms, ensuring that the alpha-generating mathematical relationships remain concealed from the broader market. This is not merely a matter of restricting access, but of protecting the core intellectual property that interprets market flow.
Furthermore, sophisticated quantitative frameworks deploy a Modular Strategy Protocol, breaking down complex trading algorithms into distinct, manageable modules to navigate computational limits and vast codebases. In such an architecture, TMF serves as a dedicated "directional filter module," seamlessly communicating the state of money flow to separate execution and risk-management modules. Institutions monitor the TMF zero-line to confirm whether their own algorithmic orders are swimming with or against the broader macroeconomic tide. While a retail trader might see a sudden price drop and panic sell, an institutional model reading a positive, rising TMF will recognize the drop as a low-volume liquidity sweep—an engineered move designed to clear retail stop-losses before the true markup phase begins. This asymmetry of information, driven by superior analytical tools and rigid logic protection, is precisely why institutional capital consistently extracts alpha from the retail market. Understanding Twiggs Money Flow is, therefore, an exercise in aligning one's perspective with the smart money, observing the footprint of block orders and algorithmic accumulation hidden deep within the smoothed volume metrics.
● Strategic Variance: Navigating Diverse Market Regimes
No technical indicator is universally omnipotent across all market conditions, and the application of Twiggs Money Flow must adapt to the prevailing market regime. The strategic variance of TMF requires traders to identify whether they are operating in a trending, ranging, or hyper-volatile environment.
• The Trending Regime: In a strongly directional market, TMF serves as the ultimate arbiter of trend health. During a robust bullish trend, the oscillator should reside firmly above the zero line. Minor price pullbacks that occur while TMF remains positive are classified as high-probability continuation setups. The trend is only considered mathematically compromised when TMF sharply breaches the zero line, indicating a structural shift in capital flows. Breakout traders utilize TMF to validate resistance breaches; a breakout accompanied by a surging positive TMF carries a significantly higher probability of success than one occurring on flat or negative money flow.
• The Ranging Regime: When price enters a state of horizontal consolidation—a Wyckoff accumulation or distribution phase—moving averages fail and trendlines become useless. Here, TMF becomes an invaluable X-ray machine. While price oscillates aimlessly between support and resistance, the TMF line will often begin to trend directionally. If price is flat but TMF is steadily rising toward or above the zero line, it signals that large operators are quietly absorbing supply, preparing for an upward expansion. Conversely, a declining TMF during consolidation warns of impending distribution and a downward breakdown.
• The High-Volatility Regime: In environments characterized by erratic price action, sudden macroeconomic shocks, or specific high-beta equities, traditional volume indicators become erratic and unreadable. Because TMF utilizes True Range, it actively dampens the distortion caused by massive overnight gaps and algorithmic flash crashes. The exponential smoothing inherent in Wilder's method acts as a kinetic shock absorber. In these volatile regimes, traders must widen their lookback periods, allowing the TMF to smooth out the noise and reveal the underlying core bias of the market. The strategic application of TMF is thus not static; it is a dynamic methodology that requires constant recalibration based on the volatility and structural geometry of the current price action.
● Psychological Architecture: The Cognitive Battleground
The implementation of sophisticated volume metrics extends far beyond mere mathematics; it requires a fortified psychological architecture. Trading with Twiggs Money Flow forces the practitioner into a cognitive battleground where patience constantly wars with the impulse for immediate action. Because TMF applies robust exponential smoothing to price and volume data, it is, by definition, a lagging indicator. It does not predict the exact top or bottom tick; rather, it confirms that a structural shift in capital has already occurred. This lagging nature tests the emotional discipline of the trader. The psychological urge to front-run the indicator—to anticipate a zero-line crossover before it actually prints—is a common cognitive trap that leads to premature entries and unnecessary drawdowns. Traders must cultivate the emotional stamina to wait for absolute mathematical confirmation, recognizing that missing the first fraction of a move is the necessary premium paid for institutional-grade certainty.
Furthermore, holding a position during a trending market requires immense psychological fortitude. Price will inevitably experience violent intraday pullbacks that trigger fear and the desire to secure early profits. However, if the trader's cognitive framework is anchored to the TMF, they can observe that despite the price drop, the oscillator remains securely above the zero line. This provides the psychological armor needed to ride out the noise, trusting the volume data over the deceptive fluctuations of the price chart. Another significant hurdle is the confirmation bias associated with divergence. Traders actively hunting for reversals will often hallucinate divergence where none structurally exists, or they will act on micro-divergences on lower timeframes that hold no macroeconomic weight. Mastering the psychological architecture of TMF means accepting that the indicator is a tool of objective probability, not a magical talisman. It requires the trader to subjugate their ego and emotional impulsivity to the cold, rational output of smoothed volume data, operating with the detached precision of an algorithmic engine.
● Risk & Probability Sagas: The Mathematical Philosophy of Capital Preservation
In the highest echelons of quantitative trading, there is no certainty, only the relentless management of risk and the pursuit of positive expectancy. The application of Twiggs Money Flow must be heavily wrapped in a strict mathematical philosophy of capital preservation. Every signal generated by TMF—be it a zero-line crossover or a sweeping macroeconomic divergence—must be viewed through the lens of asymmetric risk-to-reward. The indicator identifies the presence of institutional volume, but it does not guarantee that this volume will immediately overwhelm opposing liquidity. Therefore, position sizing must be dynamically calibrated based on the confluence of TMF with other structural market elements, such as SMC patterns, critical order blocks, or liquidity voids. A TMF zero-line cross occurring in the middle of a random price range carries a lower probability weight than a cross that coincides with price rebounding from a major order block. Risk management dictates that capital exposure should be scaled accordingly.
Furthermore, the mathematical philosophy of TMF involves understanding the concept of invalidation points. When a trade is executed based on bullish money flow, the trader must define the exact structural price level that, if breached, mathematically invalidates the bullish premise, regardless of what the lagging TMF is printing. Stop-losses are not placed arbitrarily; they are placed where the underlying logic of the trade is proven false. The saga of risk is continuous and unforgiving. Drawdowns will occur, and false signals will occasionally manifest during chaotic market transitions. However, by systematically applying the Twiggs Money Flow to filter out low-probability environments, and by rigorously enforcing asymmetric risk profiles—risking one unit of capital to secure three or more—the quantitative trader builds an impenetrable fortress around their portfolio. The true power of TMF is not in winning every trade, but in providing the probabilistic edge necessary to survive the statistical variance of the financial markets and emerge profitable over a vast sample size of executions.
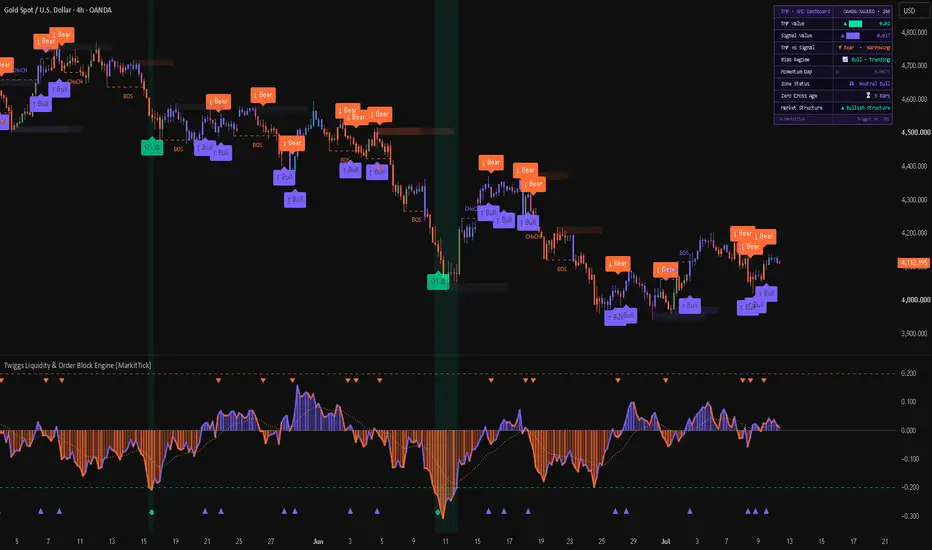
We attempted to apply Twiggs Money Flow concepts to Twiggs Liquidity & Order Block Engine indicator and added several features to assist with chart analysis.
● Professional Financial Risk Warning:
The information provided in this article is for educational and informational purposes only and does not constitute financial, investment, or trading advice. Trading in financial markets, including equities, commodities, and derivatives, involves a significant risk of loss and is not suitable for all investors. Past performance of any trading system, methodology, or indicator, including the Twiggs Money Flow, is not necessarily indicative of future results. The concepts of algorithmic trading, quantitative analysis, and technical indicators are subject to market volatility, liquidity risks, and systemic anomalies. Readers are solely responsible for their own investment decisions and should consult with a qualified, licensed financial advisor before committing real capital to any market strategy. No responsibility for any direct or indirect losses incurred as a result of applying the theories and concepts discussed herein. Ensure stringent risk management protocols are utilized at all times.
The financial markets are fundamentally an arena of auction mechanics, where the invisible hand of liquidity dictates every structural shift in price. In the pursuit of deciphering these capital movements, technical analysis has long relied on volume as the primary forensic evidence of institutional participation. Historically, the Accumulation/Distribution line and its derivative, the Chaikin Money Flow (CMF), served as the standard barometers for buying and selling pressure. However, standard analytical constructs often possess inherent structural flaws that render them vulnerable to market noise, artificial volatility, and sudden liquidity gaps. Recognizing these mathematical vulnerabilities, Colin Twiggs engineered a highly sophisticated evolution of the Chaikin Money Flow, an oscillator that would come to be known as the Twiggs Money Flow (TMF).
At its core, the genesis of Twiggs Money Flow represents a critical leap from retail-grade observation to institutional-grade volume forensics. The conceptual origin of TMF is rooted in two significant adjustments to standard volume theory: the integration of True Range and the application of exponential smoothing. Traditional money flow indicators calculate the Close Location Value based strictly on the daily high and low, entirely ignoring the reality of overnight gaps. When a market gaps significantly—a frequent occurrence in volatile equities or during major macroeconomic releases—traditional indicators become blind to the true distance price has traveled. By substituting the standard daily range with True Range, TMF effectively captures the gap, acknowledging that the previous day's close is a vital anchor point for current liquidity dynamics.
Furthermore, Twiggs recognized that simple moving averages and cumulative sums create a "drop-off" distortion. When an exceptionally high volume day finally exits the lookback window of a simple average, the indicator line can spike or plunge violently, producing a false signal that has nothing to do with current market dynamics. To eliminate this lagging artifact, Twiggs applied Welles Wilder's method of exponential smoothing, ensuring that older data decays organically rather than falling off a cliff. This elegant mathematical refinement aligns seamlessly with Wyckoff theory and Smart Money Concepts (SMC), allowing quantitative developers and discretionary analysts to track stealth accumulation and distribution with unparalleled fidelity. By refining the inputs, TMF provides a crystalline view of money flow, serving as the heartbeat monitor for underlying institutional conviction.
● Narrative Technical Analysis: Deciphering the Microstructure
To truly leverage the power of Twiggs Money Flow, one must move beyond superficial overbought or oversold paradigms and understand the narrative of price microstructure that the indicator translates. The mechanics of TMF are best understood as a continuous evaluation of where the closing price settles relative to the absolute extremes of market action. In any given session, the battle between buyers and sellers culminates at the closing bell. If the close is situated near the True High, the algorithm interprets the session's volume as predominantly bullish, allocating a positive weight to that volume. Conversely, if the close is anchored near the True Low, the volume is classified as bearish distribution.
The precise location of the close determines the exact fractional weighting applied to the volume, meaning a close exactly at the midpoint of the True Range registers as entirely neutral, contributing zero directional pressure to the oscillator. This weighted volume is then subjected to Wilder's exponential smoothing, creating a dynamic moving average of accumulation or distribution. Simultaneously, the raw total volume is subjected to the same exponential smoothing process. The final oscillator value is simply the ratio of these two smoothed metrics, bound mathematically as a percentage that oscillates above and below a central zero line.
When observing the TMF visually, the zero line represents the absolute equilibrium of market forces. A sustained journey into positive territory dictates that capital is actively entering the asset, providing the necessary hydrostatic pressure to lift prices higher. A persistent negative reading warns that smart money is quietly offloading inventory, often while retail participants are blindly buying the dip. One of the most profound narrative signals generated by TMF is the divergence sequence. When price action prints a higher high, but the TMF prints a lower high, it is a structural anomaly indicating that the upward momentum is devoid of supporting volume; the buying pressure is exhausted, and a reversal is imminent. Conversely, a bullish divergence, where price achieves a lower low while TMF forms a higher low, reveals that the downward thrust is occurring on dwindling selling pressure, often signaling a stealth accumulation phase. Because TMF relies on exponential smoothing rather than strict cumulative totals, its trajectory is exceptionally fluid, filtering out the chaotic intraday noise and presenting a pure, unadulterated narrative of the prevailing liquidity trend.
● Institutional vs. Retail Perspective: The Liquidity Divide
The dichotomy between retail speculation and institutional execution is starkly illuminated through the lens of volume analysis. Retail traders, often equipped with rudimentary tools and surface-level knowledge, typically interpret volume through simplistic vertical bars or standard CMF outputs. They are frequently victimized by gap traps, buying aggressively after a massive morning gap up, unaware that the true range distribution indicates heavy institutional selling into their buying pressure. Institutions, hedge funds, and sophisticated quantitative desks operate in a different reality entirely. They require tools that accurately measure true market participation across multiple sessions, untainted by the mathematical glitches of simple moving averages.
For the institutional quantitative developer, indicators like Twiggs Money Flow are rarely used as standalone discretionary signals; they are foundational data points ingested into complex algorithmic engines. In the modern landscape of high-frequency and algorithmic trading, robust logic protection is paramount. Proprietary scripts and trading models utilizing advanced metrics like TMF are strictly guarded through licensing and logic protection mechanisms, ensuring that the alpha-generating mathematical relationships remain concealed from the broader market. This is not merely a matter of restricting access, but of protecting the core intellectual property that interprets market flow.
Furthermore, sophisticated quantitative frameworks deploy a Modular Strategy Protocol, breaking down complex trading algorithms into distinct, manageable modules to navigate computational limits and vast codebases. In such an architecture, TMF serves as a dedicated "directional filter module," seamlessly communicating the state of money flow to separate execution and risk-management modules. Institutions monitor the TMF zero-line to confirm whether their own algorithmic orders are swimming with or against the broader macroeconomic tide. While a retail trader might see a sudden price drop and panic sell, an institutional model reading a positive, rising TMF will recognize the drop as a low-volume liquidity sweep—an engineered move designed to clear retail stop-losses before the true markup phase begins. This asymmetry of information, driven by superior analytical tools and rigid logic protection, is precisely why institutional capital consistently extracts alpha from the retail market. Understanding Twiggs Money Flow is, therefore, an exercise in aligning one's perspective with the smart money, observing the footprint of block orders and algorithmic accumulation hidden deep within the smoothed volume metrics.
● Strategic Variance: Navigating Diverse Market Regimes
No technical indicator is universally omnipotent across all market conditions, and the application of Twiggs Money Flow must adapt to the prevailing market regime. The strategic variance of TMF requires traders to identify whether they are operating in a trending, ranging, or hyper-volatile environment.
• The Trending Regime: In a strongly directional market, TMF serves as the ultimate arbiter of trend health. During a robust bullish trend, the oscillator should reside firmly above the zero line. Minor price pullbacks that occur while TMF remains positive are classified as high-probability continuation setups. The trend is only considered mathematically compromised when TMF sharply breaches the zero line, indicating a structural shift in capital flows. Breakout traders utilize TMF to validate resistance breaches; a breakout accompanied by a surging positive TMF carries a significantly higher probability of success than one occurring on flat or negative money flow.
• The Ranging Regime: When price enters a state of horizontal consolidation—a Wyckoff accumulation or distribution phase—moving averages fail and trendlines become useless. Here, TMF becomes an invaluable X-ray machine. While price oscillates aimlessly between support and resistance, the TMF line will often begin to trend directionally. If price is flat but TMF is steadily rising toward or above the zero line, it signals that large operators are quietly absorbing supply, preparing for an upward expansion. Conversely, a declining TMF during consolidation warns of impending distribution and a downward breakdown.
• The High-Volatility Regime: In environments characterized by erratic price action, sudden macroeconomic shocks, or specific high-beta equities, traditional volume indicators become erratic and unreadable. Because TMF utilizes True Range, it actively dampens the distortion caused by massive overnight gaps and algorithmic flash crashes. The exponential smoothing inherent in Wilder's method acts as a kinetic shock absorber. In these volatile regimes, traders must widen their lookback periods, allowing the TMF to smooth out the noise and reveal the underlying core bias of the market. The strategic application of TMF is thus not static; it is a dynamic methodology that requires constant recalibration based on the volatility and structural geometry of the current price action.
● Psychological Architecture: The Cognitive Battleground
The implementation of sophisticated volume metrics extends far beyond mere mathematics; it requires a fortified psychological architecture. Trading with Twiggs Money Flow forces the practitioner into a cognitive battleground where patience constantly wars with the impulse for immediate action. Because TMF applies robust exponential smoothing to price and volume data, it is, by definition, a lagging indicator. It does not predict the exact top or bottom tick; rather, it confirms that a structural shift in capital has already occurred. This lagging nature tests the emotional discipline of the trader. The psychological urge to front-run the indicator—to anticipate a zero-line crossover before it actually prints—is a common cognitive trap that leads to premature entries and unnecessary drawdowns. Traders must cultivate the emotional stamina to wait for absolute mathematical confirmation, recognizing that missing the first fraction of a move is the necessary premium paid for institutional-grade certainty.
Furthermore, holding a position during a trending market requires immense psychological fortitude. Price will inevitably experience violent intraday pullbacks that trigger fear and the desire to secure early profits. However, if the trader's cognitive framework is anchored to the TMF, they can observe that despite the price drop, the oscillator remains securely above the zero line. This provides the psychological armor needed to ride out the noise, trusting the volume data over the deceptive fluctuations of the price chart. Another significant hurdle is the confirmation bias associated with divergence. Traders actively hunting for reversals will often hallucinate divergence where none structurally exists, or they will act on micro-divergences on lower timeframes that hold no macroeconomic weight. Mastering the psychological architecture of TMF means accepting that the indicator is a tool of objective probability, not a magical talisman. It requires the trader to subjugate their ego and emotional impulsivity to the cold, rational output of smoothed volume data, operating with the detached precision of an algorithmic engine.
● Risk & Probability Sagas: The Mathematical Philosophy of Capital Preservation
In the highest echelons of quantitative trading, there is no certainty, only the relentless management of risk and the pursuit of positive expectancy. The application of Twiggs Money Flow must be heavily wrapped in a strict mathematical philosophy of capital preservation. Every signal generated by TMF—be it a zero-line crossover or a sweeping macroeconomic divergence—must be viewed through the lens of asymmetric risk-to-reward. The indicator identifies the presence of institutional volume, but it does not guarantee that this volume will immediately overwhelm opposing liquidity. Therefore, position sizing must be dynamically calibrated based on the confluence of TMF with other structural market elements, such as SMC patterns, critical order blocks, or liquidity voids. A TMF zero-line cross occurring in the middle of a random price range carries a lower probability weight than a cross that coincides with price rebounding from a major order block. Risk management dictates that capital exposure should be scaled accordingly.
Furthermore, the mathematical philosophy of TMF involves understanding the concept of invalidation points. When a trade is executed based on bullish money flow, the trader must define the exact structural price level that, if breached, mathematically invalidates the bullish premise, regardless of what the lagging TMF is printing. Stop-losses are not placed arbitrarily; they are placed where the underlying logic of the trade is proven false. The saga of risk is continuous and unforgiving. Drawdowns will occur, and false signals will occasionally manifest during chaotic market transitions. However, by systematically applying the Twiggs Money Flow to filter out low-probability environments, and by rigorously enforcing asymmetric risk profiles—risking one unit of capital to secure three or more—the quantitative trader builds an impenetrable fortress around their portfolio. The true power of TMF is not in winning every trade, but in providing the probabilistic edge necessary to survive the statistical variance of the financial markets and emerge profitable over a vast sample size of executions.
We attempted to apply Twiggs Money Flow concepts to Twiggs Liquidity & Order Block Engine indicator and added several features to assist with chart analysis.
● Professional Financial Risk Warning:
The information provided in this article is for educational and informational purposes only and does not constitute financial, investment, or trading advice. Trading in financial markets, including equities, commodities, and derivatives, involves a significant risk of loss and is not suitable for all investors. Past performance of any trading system, methodology, or indicator, including the Twiggs Money Flow, is not necessarily indicative of future results. The concepts of algorithmic trading, quantitative analysis, and technical indicators are subject to market volatility, liquidity risks, and systemic anomalies. Readers are solely responsible for their own investment decisions and should consult with a qualified, licensed financial advisor before committing real capital to any market strategy. No responsibility for any direct or indirect losses incurred as a result of applying the theories and concepts discussed herein. Ensure stringent risk management protocols are utilized at all times.

💡 Proprietary indicators. Original research. Built by analysts who trade.
👑 Premium: markittick.com
📢 Free Telegram: t.me/MarkitTick_Updates
👑 Premium: markittick.com
📢 Free Telegram: t.me/MarkitTick_Updates
Clause de non-responsabilité
Les informations et publications ne sont pas destinées à être, et ne constituent pas, des conseils ou recommandations financiers, d'investissement, de trading ou autres fournis ou approuvés par TradingView. Pour en savoir plus, consultez les Conditions d'utilisation.
💡 Proprietary indicators. Original research. Built by analysts who trade.
👑 Premium: markittick.com
📢 Free Telegram: t.me/MarkitTick_Updates
👑 Premium: markittick.com
📢 Free Telegram: t.me/MarkitTick_Updates
Clause de non-responsabilité
Les informations et publications ne sont pas destinées à être, et ne constituent pas, des conseils ou recommandations financiers, d'investissement, de trading ou autres fournis ou approuvés par TradingView. Pour en savoir plus, consultez les Conditions d'utilisation.