
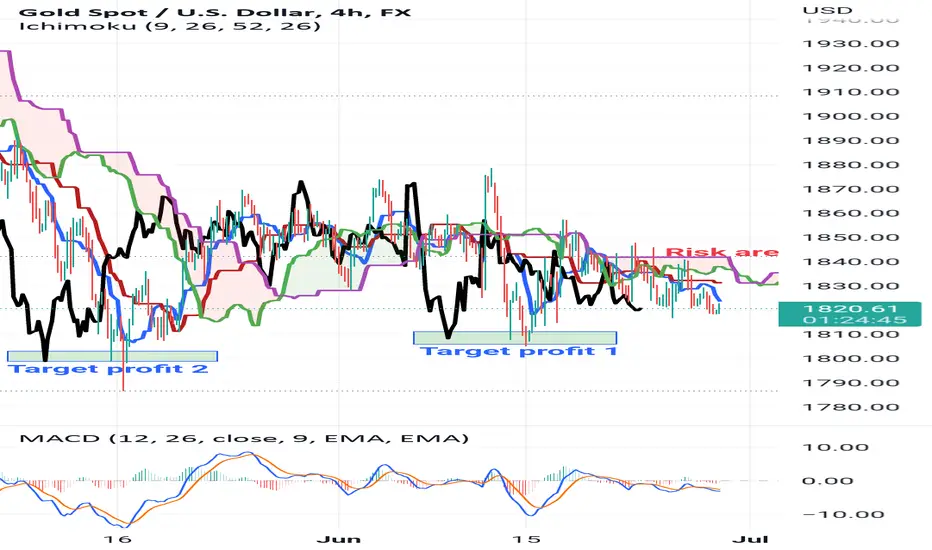
As we can see from 4H chart, from ichimoku indicator perspective, chikou span below the cloud, candle below the cloud, kijun above tenkan. It is indicating bearish market.
From MACD perspective it is below 0, which it is bearish market.
I also mark the risk area (red area) and possible taking profit area (blue color).
Happy trading. Manage your own risk and target.
From MACD perspective it is below 0, which it is bearish market.
I also mark the risk area (red area) and possible taking profit area (blue color).
Happy trading. Manage your own risk and target.

Clause de non-responsabilité
Les informations et publications ne sont pas destinées à être, et ne constituent pas, des conseils ou recommandations financiers, d'investissement, de trading ou autres fournis ou approuvés par TradingView. Pour en savoir plus, consultez les Conditions d'utilisation.
Clause de non-responsabilité
Les informations et publications ne sont pas destinées à être, et ne constituent pas, des conseils ou recommandations financiers, d'investissement, de trading ou autres fournis ou approuvés par TradingView. Pour en savoir plus, consultez les Conditions d'utilisation.