
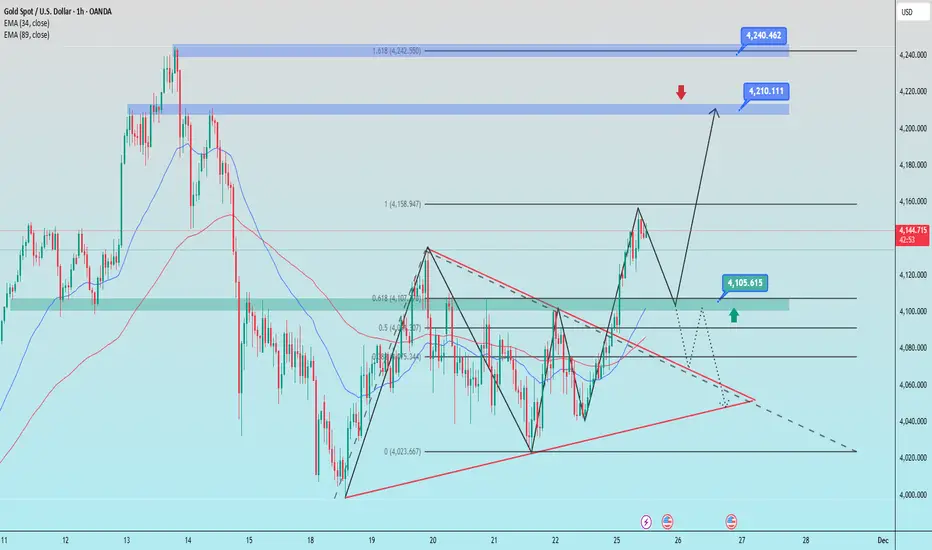
✅ 1. Trend Lines
Upper trend line (red - descending)
Connects a series of lower highs → acts as strong dynamic resistance.
Price has broken through the trend line and is retesting it → the short-term trend will turn bullish if the retest is successful.
Lower trend line (red - ascending)
Connects the upper lows → acts as dynamic support for a symmetrical triangle pattern (consolidation).
This area coincides with a Fibonacci level → strong support – confluence if the price continues to correct.
✅ 2. Key Support – Resistance
Resistance
4,210 – 4,240:
→ Key resistance – short-term bearish potential.
Breaking above the 1.618 Fibonacci level
→ Strong resistance – take-profit zone for buyers.
Support
4.105 – 4.100 (green zone):
Retest zone after breakout
Fibonacci support 0.5–0.618
→ Best buy zone if price retests.
✅ 3. Fibonacci
0.618 at 4.105: First retest → chart reaction.
On the downside, the 4.071 zone touches the trendline.
Extension 1.618 at 4.240: Maximum target if the uptrend is confirmed.
🎯 Trading Plan
BUY GOLD: 4105 – 4103
Stop Loss: 4093
Take Profit: 100 – 300 – 500 pips
SELL GOLD: 4210 – 4212
Stop Loss: 4222
Take Profit: 100 – 300 – 500 pips
Upper trend line (red - descending)
Connects a series of lower highs → acts as strong dynamic resistance.
Price has broken through the trend line and is retesting it → the short-term trend will turn bullish if the retest is successful.
Lower trend line (red - ascending)
Connects the upper lows → acts as dynamic support for a symmetrical triangle pattern (consolidation).
This area coincides with a Fibonacci level → strong support – confluence if the price continues to correct.
✅ 2. Key Support – Resistance
Resistance
4,210 – 4,240:
→ Key resistance – short-term bearish potential.
Breaking above the 1.618 Fibonacci level
→ Strong resistance – take-profit zone for buyers.
Support
4.105 – 4.100 (green zone):
Retest zone after breakout
Fibonacci support 0.5–0.618
→ Best buy zone if price retests.
✅ 3. Fibonacci
0.618 at 4.105: First retest → chart reaction.
On the downside, the 4.071 zone touches the trendline.
Extension 1.618 at 4.240: Maximum target if the uptrend is confirmed.
🎯 Trading Plan
BUY GOLD: 4105 – 4103
Stop Loss: 4093
Take Profit: 100 – 300 – 500 pips
SELL GOLD: 4210 – 4212
Stop Loss: 4222
Take Profit: 100 – 300 – 500 pips
Note
The price is going exactly as I analyzed but unfortunately I missed the target and now the price has reflected more than 200 pips
✅MY FREE FOREX & XAUUSD SIGNALS TELEGRAM CHANNEL:
t.me/+ZuY5gdO0R-k5NWM1
🔴9-12 signals per day
🔴Free knowledge support
🔴24/7 support for newbies.
🔴You always have priority.
FXWARRIOR 😘
t.me/+ZuY5gdO0R-k5NWM1
🔴9-12 signals per day
🔴Free knowledge support
🔴24/7 support for newbies.
🔴You always have priority.
FXWARRIOR 😘
Publications connexes
Clause de non-responsabilité
Les informations et publications ne sont pas destinées à être, et ne constituent pas, des conseils ou recommandations financiers, d'investissement, de trading ou autres fournis ou approuvés par TradingView. Pour en savoir plus, consultez les Conditions d'utilisation.
✅MY FREE FOREX & XAUUSD SIGNALS TELEGRAM CHANNEL:
t.me/+ZuY5gdO0R-k5NWM1
🔴9-12 signals per day
🔴Free knowledge support
🔴24/7 support for newbies.
🔴You always have priority.
FXWARRIOR 😘
t.me/+ZuY5gdO0R-k5NWM1
🔴9-12 signals per day
🔴Free knowledge support
🔴24/7 support for newbies.
🔴You always have priority.
FXWARRIOR 😘
Publications connexes
Clause de non-responsabilité
Les informations et publications ne sont pas destinées à être, et ne constituent pas, des conseils ou recommandations financiers, d'investissement, de trading ou autres fournis ou approuvés par TradingView. Pour en savoir plus, consultez les Conditions d'utilisation.