
Horizon: 12-Month Outlook (Q1 2026 – Q1 2027)
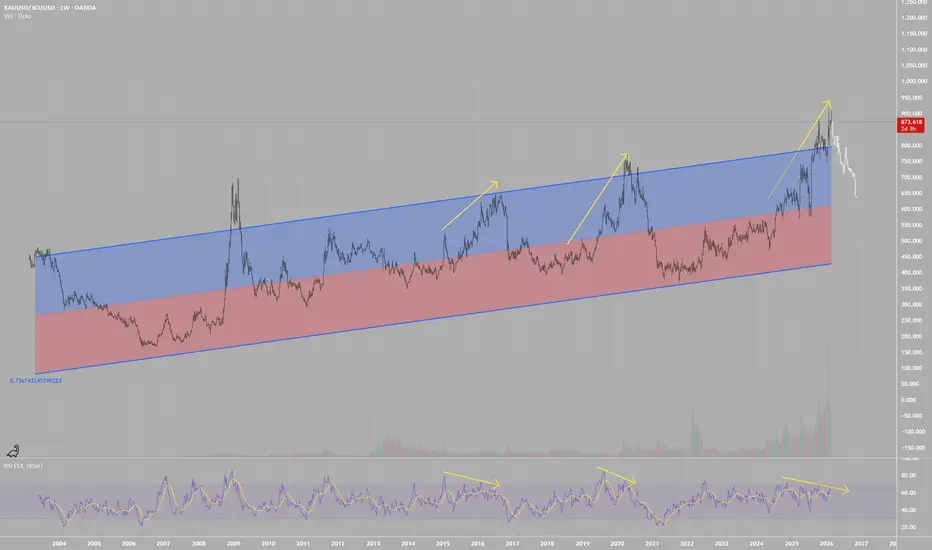
The Gold to Copper ratio sitting at 874 to 1 is a massive outlier. Historically, when this ratio stretches this much, it snaps back within a 6-12 month window.
Bearish RSI Divergence has been building during this entire rise to 874 to 1. The same signal that preceded the standard mean reversions in 2016 and 2020. (Yellow arrows on chart)
Right now, Gold is at $5,200/oz while Copper is primarily being ignored by the mainstream. If all metals continue to rise through 2026 as expected, the question isn't if Copper catches up, but how fast.
If we just move back to the top of the historical regression trend (800 to 1) or a standard mean (650 to 1), here is what the Copper price looks like at different Gold levels.
Gold Price: $5200 (Current)
800 to 1 Ratio: $6.50/lb +9.2%
650 to 1 Ratio: $8.00/lb +34.5%
Gold Price: $5600 (ATH)
800 to 1 Ratio: $7.00/lb +17.7%
650 to 1 Ratio: $8.61/lb +44.7%
Gold Price: $7000 (EOY Possible Target)
800 to 1 Ratio: $8.75/lb +47.1%
650 to 1 Ratio: $10.76/lb +80.8%
-Copper is in a supply deficit for the foreseeable future.
-Data centers and power grid upgrades are "must-buy" industries. They don't care if Copper is $6 or $9. They need it to build.
-Silver already broke out to $120/oz currently at $90/oz. Silver and Copper are basically first cousins in the electrical world.
If we see a true mean reversion (650 ratio) alongside the Gold bull run everyone is expecting, you're looking at 35% to 80% gains in the physical metal.
Now, lets look at Copper/USD

- 1989 – 2005 Copper stayed in a tight range between $0.59 and $1.50. When it finally broke out in March 2005, it ran 182% in 1189 days.
- 2005 – 2025: For the last 20 years, we’ve been stuck in a new, larger range between $1.96 and $4.50.
- The Breakout: March 2025 was the first time in two decades we closed a monthly candle above $4.50.
- The Retest: After hitting $5.95 in July 2025, we back-tested $4.50 perfectly. That old resistance is now confirmed major support.
As of late February 2026, we are ripping back toward $6.00 and going vertical. We are only 336 days into a breakout that took 20 years to build. Copper is a coiled spring for 2026.
The Gold to Copper ratio sitting at 874 to 1 is a massive outlier. Historically, when this ratio stretches this much, it snaps back within a 6-12 month window.
Bearish RSI Divergence has been building during this entire rise to 874 to 1. The same signal that preceded the standard mean reversions in 2016 and 2020. (Yellow arrows on chart)
Right now, Gold is at $5,200/oz while Copper is primarily being ignored by the mainstream. If all metals continue to rise through 2026 as expected, the question isn't if Copper catches up, but how fast.
If we just move back to the top of the historical regression trend (800 to 1) or a standard mean (650 to 1), here is what the Copper price looks like at different Gold levels.
Gold Price: $5200 (Current)
800 to 1 Ratio: $6.50/lb +9.2%
650 to 1 Ratio: $8.00/lb +34.5%
Gold Price: $5600 (ATH)
800 to 1 Ratio: $7.00/lb +17.7%
650 to 1 Ratio: $8.61/lb +44.7%
Gold Price: $7000 (EOY Possible Target)
800 to 1 Ratio: $8.75/lb +47.1%
650 to 1 Ratio: $10.76/lb +80.8%
-Copper is in a supply deficit for the foreseeable future.
-Data centers and power grid upgrades are "must-buy" industries. They don't care if Copper is $6 or $9. They need it to build.
-Silver already broke out to $120/oz currently at $90/oz. Silver and Copper are basically first cousins in the electrical world.
If we see a true mean reversion (650 ratio) alongside the Gold bull run everyone is expecting, you're looking at 35% to 80% gains in the physical metal.
Now, lets look at Copper/USD
- 1989 – 2005 Copper stayed in a tight range between $0.59 and $1.50. When it finally broke out in March 2005, it ran 182% in 1189 days.
- 2005 – 2025: For the last 20 years, we’ve been stuck in a new, larger range between $1.96 and $4.50.
- The Breakout: March 2025 was the first time in two decades we closed a monthly candle above $4.50.
- The Retest: After hitting $5.95 in July 2025, we back-tested $4.50 perfectly. That old resistance is now confirmed major support.
As of late February 2026, we are ripping back toward $6.00 and going vertical. We are only 336 days into a breakout that took 20 years to build. Copper is a coiled spring for 2026.

Clause de non-responsabilité
Les informations et publications ne sont pas destinées à être, et ne constituent pas, des conseils ou recommandations financiers, d'investissement, de trading ou autres fournis ou approuvés par TradingView. Pour en savoir plus, consultez les Conditions d'utilisation.
Clause de non-responsabilité
Les informations et publications ne sont pas destinées à être, et ne constituent pas, des conseils ou recommandations financiers, d'investissement, de trading ou autres fournis ou approuvés par TradingView. Pour en savoir plus, consultez les Conditions d'utilisation.