
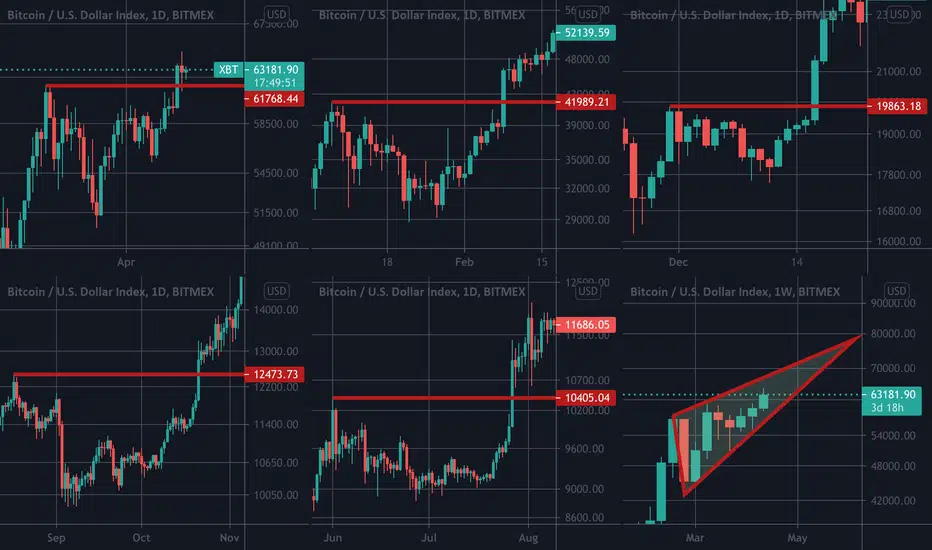
The first 5 charts are daily charts and show Bitcoin’s reactions to its resistance levels during this Bullish rally.
The last chart is weekly chart of Bitcoin.
There is a difference between the most recent and the previous four times that Bitcoin passed its resistance, can you identify what is that
Share your answer in the comments
The last chart is weekly chart of Bitcoin.
There is a difference between the most recent and the previous four times that Bitcoin passed its resistance, can you identify what is that
Share your answer in the comments

Use the following link to access trading ideas: patreon.com/SniperTraderStocks?utm_medium=unknown&utm_source=join_link&utm_campaign=creatorshare_creator&utm_content=copyLink
Clause de non-responsabilité
Les informations et publications ne sont pas destinées à être, et ne constituent pas, des conseils ou recommandations financiers, d'investissement, de trading ou autres fournis ou approuvés par TradingView. Pour en savoir plus, consultez les Conditions d'utilisation.
Use the following link to access trading ideas: patreon.com/SniperTraderStocks?utm_medium=unknown&utm_source=join_link&utm_campaign=creatorshare_creator&utm_content=copyLink
Clause de non-responsabilité
Les informations et publications ne sont pas destinées à être, et ne constituent pas, des conseils ou recommandations financiers, d'investissement, de trading ou autres fournis ou approuvés par TradingView. Pour en savoir plus, consultez les Conditions d'utilisation.