
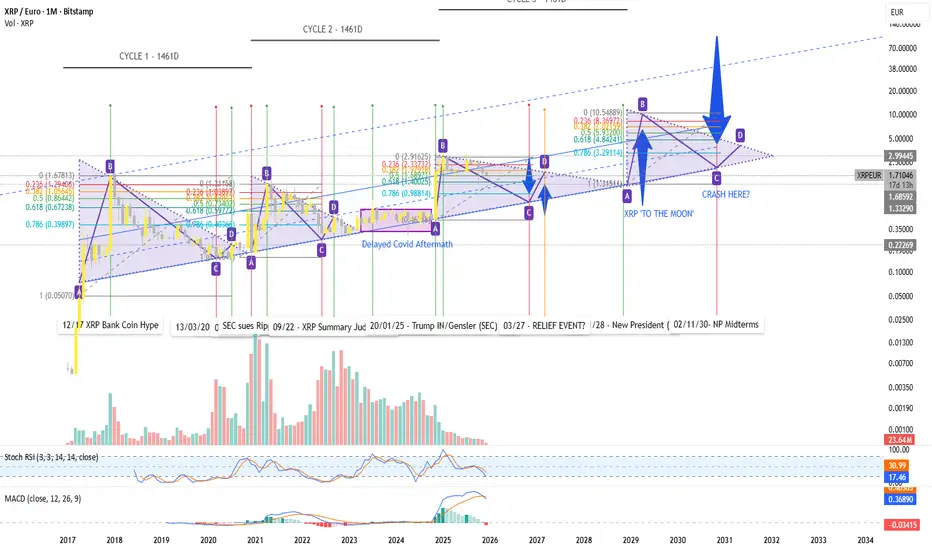
The chart maps XRP from 2017 to 2030 on a monthly timeframe.
Key external events (legal, macroeconomic, political) are explicitly marked.
Green vertical lines indicate cyclical tops, while red vertical lines indicate cyclical bottoms.
Price action develops within a clearly defined long-term ascending channel, which has been respected across multiple cycles.
Each cycle unfolds through a triangle consolidation pattern, followed by an impulse move and a corrective phase.
Fibonacci retracements are included to visualize the relationship between impulsive and corrective moves; prior corrections repeatedly align with the 0.618–0.786 levels.
The time cycles of 1,461 days (4 years) remain consistent throughout the chart, indicating a stable cyclical rhythm.
Based on time structure and pattern repetition, a cyclical endpoint is projected around 2029–2030, coinciding with a broader macroeconomic reset period.
Key external events (legal, macroeconomic, political) are explicitly marked.
Green vertical lines indicate cyclical tops, while red vertical lines indicate cyclical bottoms.
Price action develops within a clearly defined long-term ascending channel, which has been respected across multiple cycles.
Each cycle unfolds through a triangle consolidation pattern, followed by an impulse move and a corrective phase.
Fibonacci retracements are included to visualize the relationship between impulsive and corrective moves; prior corrections repeatedly align with the 0.618–0.786 levels.
The time cycles of 1,461 days (4 years) remain consistent throughout the chart, indicating a stable cyclical rhythm.
Based on time structure and pattern repetition, a cyclical endpoint is projected around 2029–2030, coinciding with a broader macroeconomic reset period.

Clause de non-responsabilité
Les informations et publications ne sont pas destinées à être, et ne constituent pas, des conseils ou recommandations financiers, d'investissement, de trading ou autres fournis ou approuvés par TradingView. Pour en savoir plus, consultez les Conditions d'utilisation.
Clause de non-responsabilité
Les informations et publications ne sont pas destinées à être, et ne constituent pas, des conseils ou recommandations financiers, d'investissement, de trading ou autres fournis ou approuvés par TradingView. Pour en savoir plus, consultez les Conditions d'utilisation.