
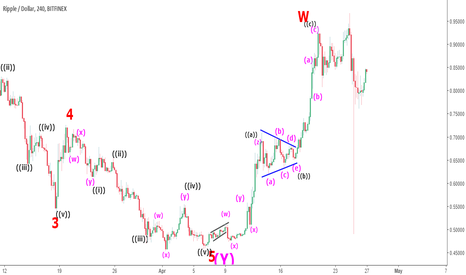
My previous post is referenced below in order to keep track of the progression of Ripple (XRPUSD).
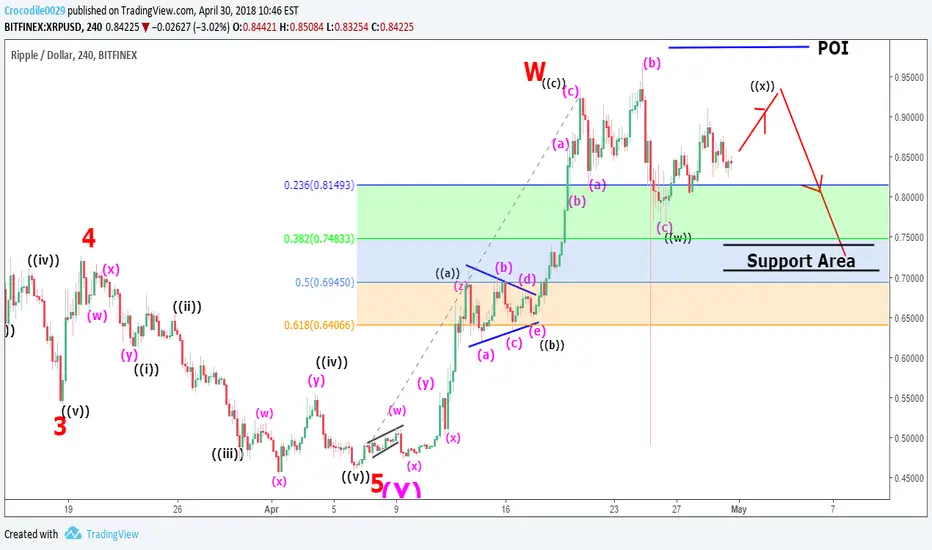
Ripple's (XRPUSD) price action has remained in a sideways trend after it closed at ~$0.92 on April 20, 2018. The sideways price action is identified in this analysis to be a combination (W-X-Y) Elliott wave structure with Minute wave ((x)) currently ongoing.
The implication of the above is that a Minute wave ((y)) should finish downwards as indicated by the red arrow on the 4hr tf chart for Ripple (XRPUSD) before XRPUSD can resume a sustainable bullish move.This analysis favors Ripple (XRPUSD) targeting between 38.2% and 50% ( i.e. ~$0.74 and $0.70) as the Support area because this lies in the region of technical support for Ripple which is between ~$0.71 and ~$0.74 as indicated by the horizontal black line.
Point of invalidation (POI) is placed just above the high of ~$0.97 reached on April 24, 2018. POI in this case is a price close above $0.99
Ripple's (XRPUSD) price action has remained in a sideways trend after it closed at ~$0.92 on April 20, 2018. The sideways price action is identified in this analysis to be a combination (W-X-Y) Elliott wave structure with Minute wave ((x)) currently ongoing.
The implication of the above is that a Minute wave ((y)) should finish downwards as indicated by the red arrow on the 4hr tf chart for Ripple (XRPUSD) before XRPUSD can resume a sustainable bullish move.This analysis favors Ripple (XRPUSD) targeting between 38.2% and 50% ( i.e. ~$0.74 and $0.70) as the Support area because this lies in the region of technical support for Ripple which is between ~$0.71 and ~$0.74 as indicated by the horizontal black line.
Point of invalidation (POI) is placed just above the high of ~$0.97 reached on April 24, 2018. POI in this case is a price close above $0.99

Clause de non-responsabilité
Les informations et publications ne sont pas destinées à être, et ne constituent pas, des conseils ou recommandations financiers, d'investissement, de trading ou autres fournis ou approuvés par TradingView. Pour en savoir plus, consultez les Conditions d'utilisation.
Clause de non-responsabilité
Les informations et publications ne sont pas destinées à être, et ne constituent pas, des conseils ou recommandations financiers, d'investissement, de trading ou autres fournis ou approuvés par TradingView. Pour en savoir plus, consultez les Conditions d'utilisation.