
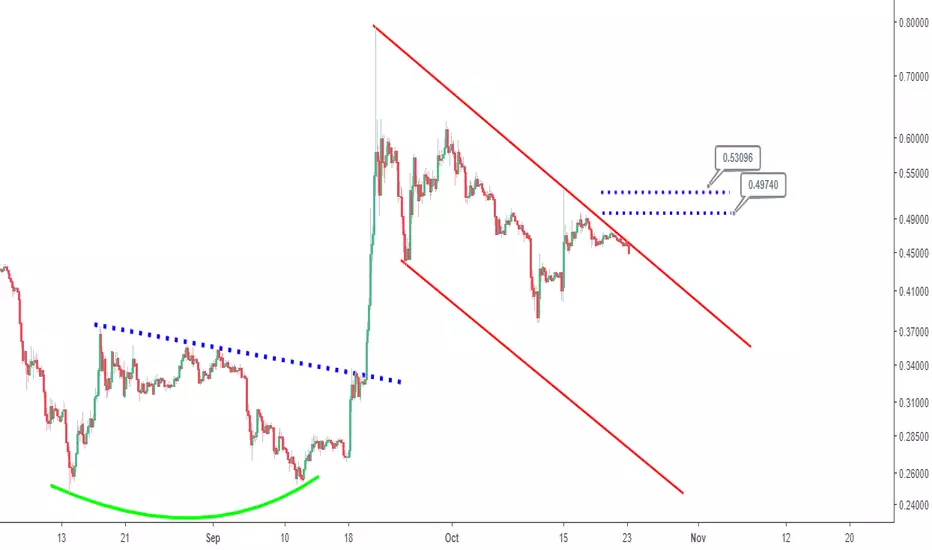
August 14, 2018 to September 20, 2018 marked the formation of a confirmed double bottom chart pattern in Ripple (XRP). Price action after confirmation reached a high of ~$0.79 before the current retracement that is captured with a bearish channel considered to be tentative.
Price action breaking to the upside of the bear channel and also above resistance as indicated by the horizontal blue lines does argue for a bullish bias for Ripple (XRP).
Price action breaking to the upside of the bear channel and also above resistance as indicated by the horizontal blue lines does argue for a bullish bias for Ripple (XRP).

Publications connexes
Clause de non-responsabilité
Les informations et publications ne sont pas destinées à être, et ne constituent pas, des conseils ou recommandations financiers, d'investissement, de trading ou autres fournis ou approuvés par TradingView. Pour en savoir plus, consultez les Conditions d'utilisation.
Publications connexes
Clause de non-responsabilité
Les informations et publications ne sont pas destinées à être, et ne constituent pas, des conseils ou recommandations financiers, d'investissement, de trading ou autres fournis ou approuvés par TradingView. Pour en savoir plus, consultez les Conditions d'utilisation.