
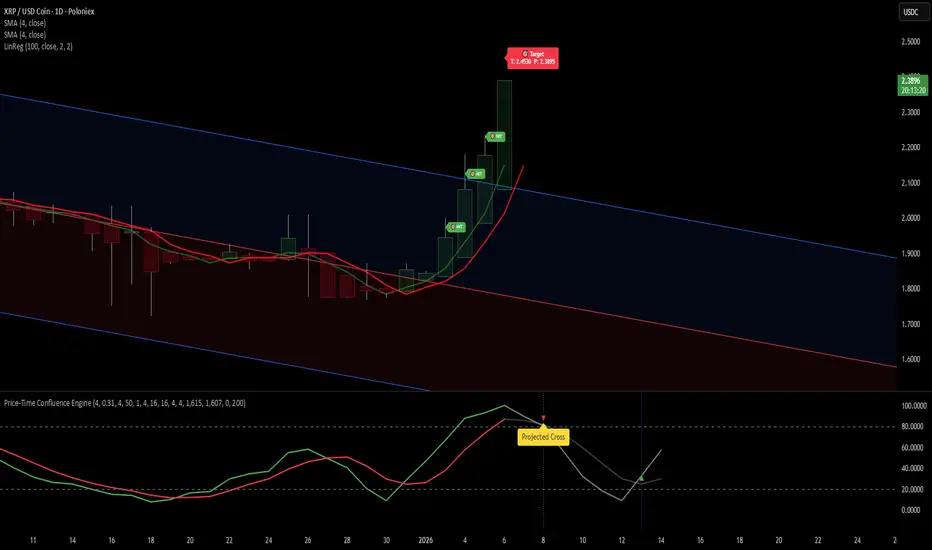
This chart presents a price–time confluence view of XRP following a sustained downtrend and subsequent structural transition. The focus is on how price interacts with dynamically generated targets, trend structure, and momentum behavior rather than on fixed predictions.
Structural Context:
Price spent an extended period moving within a descending channel, with repeated failures to sustain upside momentum.
A clear inflection developed as price stabilized near the lower boundary and began forming higher lows.
The recent advance shows a decisive break from prior compression, with price accelerating away from the channel structure.
Target Interaction:
Multiple upside targets have been reached in sequence, each marked by confirmed interactions rather than single-candle spikes.
Target hits occurred alongside expanding candle bodies, suggesting participation rather than thin liquidity moves.
The current target zone sits above recent price action and remains technically active while structure is maintained.
Trend & Baseline Behavior:
Price has reclaimed and remained above its rising median baseline, which now acts as dynamic support.
The curvature of the baseline reflects increasing trend strength rather than a flat or reactive condition.
Momentum Context:
The momentum oscillator shows a completed expansion phase followed by a projected cooling period.
The projected cross highlights a potential reset window, which often accompanies consolidation or range development rather than immediate trend failure.
Momentum structure remains elevated relative to prior cycle lows, indicating structural improvement even during pullbacks.
Forward-Looking Context (Non-Predictive):
As long as price continues to respect the rising median and prior target zones, higher reference levels remain relevant. A loss of structure or failure to hold reclaimed levels would shift focus back toward consolidation or deeper retracement instead.
This chart is designed to visualize price behavior, target interaction, and time-based momentum relationships, not to forecast outcomes. All levels should be treated as dynamic reference zones that evolve with price.
Structural Context:
Price spent an extended period moving within a descending channel, with repeated failures to sustain upside momentum.
A clear inflection developed as price stabilized near the lower boundary and began forming higher lows.
The recent advance shows a decisive break from prior compression, with price accelerating away from the channel structure.
Target Interaction:
Multiple upside targets have been reached in sequence, each marked by confirmed interactions rather than single-candle spikes.
Target hits occurred alongside expanding candle bodies, suggesting participation rather than thin liquidity moves.
The current target zone sits above recent price action and remains technically active while structure is maintained.
Trend & Baseline Behavior:
Price has reclaimed and remained above its rising median baseline, which now acts as dynamic support.
The curvature of the baseline reflects increasing trend strength rather than a flat or reactive condition.
Momentum Context:
The momentum oscillator shows a completed expansion phase followed by a projected cooling period.
The projected cross highlights a potential reset window, which often accompanies consolidation or range development rather than immediate trend failure.
Momentum structure remains elevated relative to prior cycle lows, indicating structural improvement even during pullbacks.
Forward-Looking Context (Non-Predictive):
As long as price continues to respect the rising median and prior target zones, higher reference levels remain relevant. A loss of structure or failure to hold reclaimed levels would shift focus back toward consolidation or deeper retracement instead.
This chart is designed to visualize price behavior, target interaction, and time-based momentum relationships, not to forecast outcomes. All levels should be treated as dynamic reference zones that evolve with price.

Clause de non-responsabilité
Les informations et publications ne sont pas destinées à être, et ne constituent pas, des conseils ou recommandations financiers, d'investissement, de trading ou autres fournis ou approuvés par TradingView. Pour en savoir plus, consultez les Conditions d'utilisation.
Clause de non-responsabilité
Les informations et publications ne sont pas destinées à être, et ne constituent pas, des conseils ou recommandations financiers, d'investissement, de trading ou autres fournis ou approuvés par TradingView. Pour en savoir plus, consultez les Conditions d'utilisation.