WTI Crude Oil ( XTIUSD) Daily: Momentum Accelerates Above Reclaimed 200-EMA Toward Key Wedge Resistance
### 🛢️ WTI Light Crude Oil (XTIUSD / USOIL) Daily Technical Matrix (Ref: XTIUSD_2026-08-12_08-41-35.png)
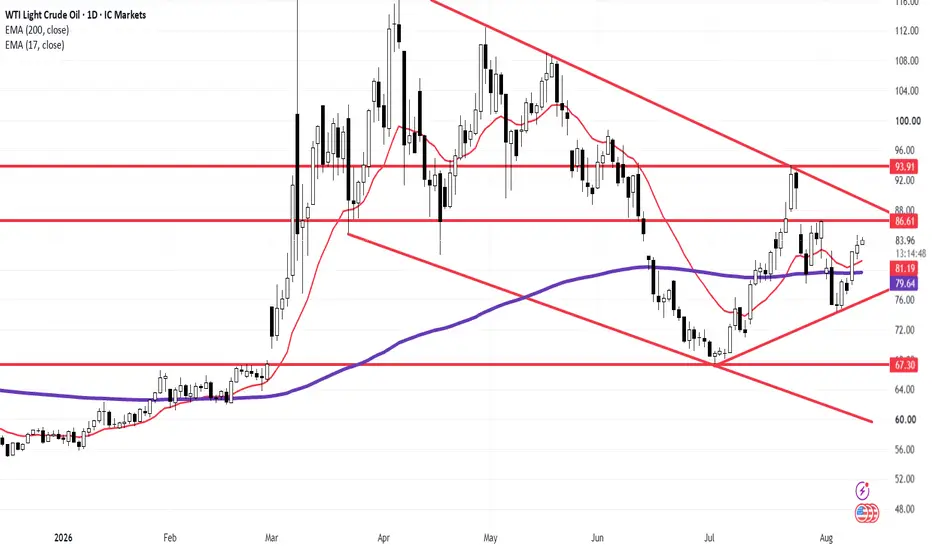
We are releasing an updated Daily (1D) structural framework on WTI Light Crude Oil (XTIUSD / USOIL). Following a successful defense of the lower trendline support and the reclamation of its key moving average cluster, price action is expanding higher inside the macro multi-month consolidation wedge.
Crude Oil is currently trading with active buy-side control at **83.94 (+0.73%)**, positioning for a retest of overhead static resistance.
---
### 🔍 Technical Architecture & Structural Dynamics:
Our quantitative setup isolates key dynamic support levels and primary resistance targets:
1. **Dual EMA Reclaim & Dynamic Support:** Price action has established a firm base above both the **200-period EMA (purple line at 79.64)** and the **17-period EMA (red line at 81.18)**, confirming a shift back toward short-term bullish momentum.
2. **Macro Wedge Squeeze Structure (Diagonal Red Lines):** Crude Oil remains contained within a broad multi-month wedge, bounded by the ascending support line originating from the **67.30** macro floor and the primary descending resistance line originating from multi-month highs.
3. **Key Horizontal Resistance Barriers:**
* **Immediate Overhead Ceiling:** **86.61** — Primary dynamic test point aligned with upper wedge supply.
* **Secondary Structural Target:** **93.91** — Major horizontal liquidity pocket.
---
### 🛡️ Strategic Operational Scenarios:
* **Scenario A — Bullish Wedge Retest & Breakout Extension:** Sustained buy-side momentum above the **81.18** EMA floor targets an immediate retest of **86.61**. A decisive daily break above **86.61** and the upper descending trendline will trigger a volatility expansion toward **93.91**.
* **Scenario B — Pullback Rejection to Dynamic EMA Support:** Any temporary profit-taking off overhead supply will find immediate absorption at the **17-EMA (81.18)** and the **200-EMA (79.64)** floor, preserving the active higher-low structure.
### 📊 Tactical Parameters Summary:
* **Current Bias:** Neutral-Bullish / Rebound Expansion Above 200-EMA
* **Immediate Static Resistance:** 86.61
* **Secondary Upside Ceiling:** 93.91
* **Immediate Dynamic Support (17-EMA):** 81.18
* **Institutional Base Support (200-EMA):** 79.64
* **Macro Structural Floor:** 67.30
---
📊 **ChartPro Data**
*Energy Market Architecture, Dynamic EMA Confluences & Systematic Risk Management.*
⚠️ **Disclaimer:** For educational and informational purposes only. This active market study represents a personal trading framework and does not constitute financial or investment advice.
XTIUSD) Daily: Momentum Accelerates Above Reclaimed 200-EMA Toward Key Wedge Resistance### 🛢️ WTI Light Crude Oil (
XTIUSD / USOIL) Daily Technical Matrix (Ref: XTIUSD_2026-08-12_08-41-35.png)We are releasing an updated Daily (1D) structural framework on WTI Light Crude Oil (
XTIUSD / USOIL). Following a successful defense of the lower trendline support and the reclamation of its key moving average cluster, price action is expanding higher inside the macro multi-month consolidation wedge.Crude Oil is currently trading with active buy-side control at **83.94 (+0.73%)**, positioning for a retest of overhead static resistance.
---
### 🔍 Technical Architecture & Structural Dynamics:
Our quantitative setup isolates key dynamic support levels and primary resistance targets:
1. **Dual EMA Reclaim & Dynamic Support:** Price action has established a firm base above both the **200-period EMA (purple line at 79.64)** and the **17-period EMA (red line at 81.18)**, confirming a shift back toward short-term bullish momentum.
2. **Macro Wedge Squeeze Structure (Diagonal Red Lines):** Crude Oil remains contained within a broad multi-month wedge, bounded by the ascending support line originating from the **67.30** macro floor and the primary descending resistance line originating from multi-month highs.
3. **Key Horizontal Resistance Barriers:**
* **Immediate Overhead Ceiling:** **86.61** — Primary dynamic test point aligned with upper wedge supply.
* **Secondary Structural Target:** **93.91** — Major horizontal liquidity pocket.
---
### 🛡️ Strategic Operational Scenarios:
* **Scenario A — Bullish Wedge Retest & Breakout Extension:** Sustained buy-side momentum above the **81.18** EMA floor targets an immediate retest of **86.61**. A decisive daily break above **86.61** and the upper descending trendline will trigger a volatility expansion toward **93.91**.
* **Scenario B — Pullback Rejection to Dynamic EMA Support:** Any temporary profit-taking off overhead supply will find immediate absorption at the **17-EMA (81.18)** and the **200-EMA (79.64)** floor, preserving the active higher-low structure.
### 📊 Tactical Parameters Summary:
* **Current Bias:** Neutral-Bullish / Rebound Expansion Above 200-EMA
* **Immediate Static Resistance:** 86.61
* **Secondary Upside Ceiling:** 93.91
* **Immediate Dynamic Support (17-EMA):** 81.18
* **Institutional Base Support (200-EMA):** 79.64
* **Macro Structural Floor:** 67.30
---
📊 **ChartPro Data**
*Energy Market Architecture, Dynamic EMA Confluences & Systematic Risk Management.*
⚠️ **Disclaimer:** For educational and informational purposes only. This active market study represents a personal trading framework and does not constitute financial or investment advice.

Clause de non-responsabilité
Les informations et publications ne sont pas destinées à être, et ne constituent pas, des conseils ou recommandations financiers, d'investissement, de trading ou autres fournis ou approuvés par TradingView. Pour en savoir plus, consultez les Conditions d'utilisation.
Clause de non-responsabilité
Les informations et publications ne sont pas destinées à être, et ne constituent pas, des conseils ou recommandations financiers, d'investissement, de trading ou autres fournis ou approuvés par TradingView. Pour en savoir plus, consultez les Conditions d'utilisation.