Long
VERGE Double Bottom ?
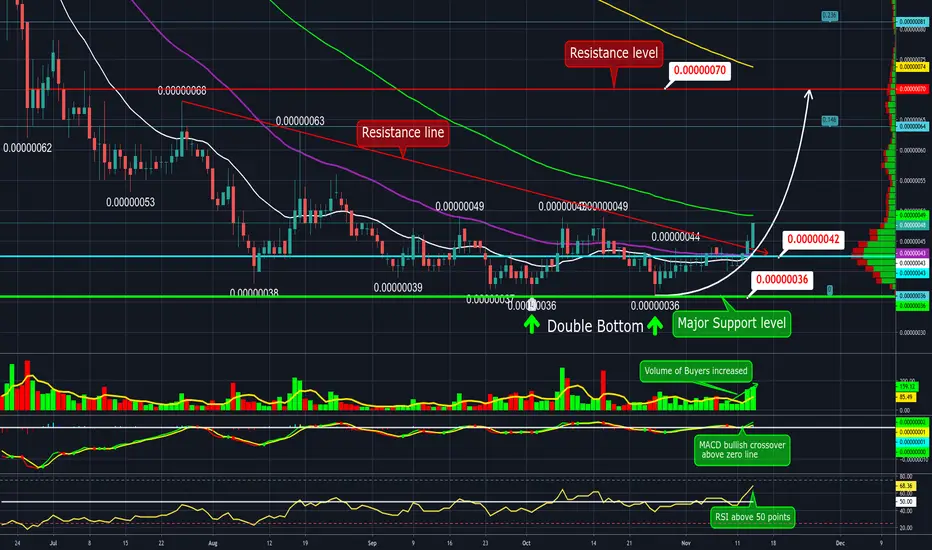
Verge price action above red resistance line breakout. Hodl above EMA 21,50 on daily TF. Testing EMA 100 which acting like resistance. Potential target 70 sats Resistance level.
Volume: of buyers increased.
Indicators: MACD bullish crossover above zero line. RSI above 50 points. Bullish sign.
Pattern: double bottom pattern at 36 sats.
S/R: Major Support 36 sats, Support 40 sats. Resistance 50 sats, Major Resistance 70 sats.
Disclaimer: THIS IS NOT FINANCIAL ADVICE. All the information shared here is for learning and entertainment purposes only.
Volume: of buyers increased.
Indicators: MACD bullish crossover above zero line. RSI above 50 points. Bullish sign.
Pattern: double bottom pattern at 36 sats.
S/R: Major Support 36 sats, Support 40 sats. Resistance 50 sats, Major Resistance 70 sats.
Disclaimer: THIS IS NOT FINANCIAL ADVICE. All the information shared here is for learning and entertainment purposes only.

Clause de non-responsabilité
Les informations et publications ne sont pas destinées à être, et ne constituent pas, des conseils ou recommandations financiers, d'investissement, de trading ou autres fournis ou approuvés par TradingView. Pour en savoir plus, consultez les Conditions d'utilisation.
Clause de non-responsabilité
Les informations et publications ne sont pas destinées à être, et ne constituent pas, des conseils ou recommandations financiers, d'investissement, de trading ou autres fournis ou approuvés par TradingView. Pour en savoir plus, consultez les Conditions d'utilisation.