
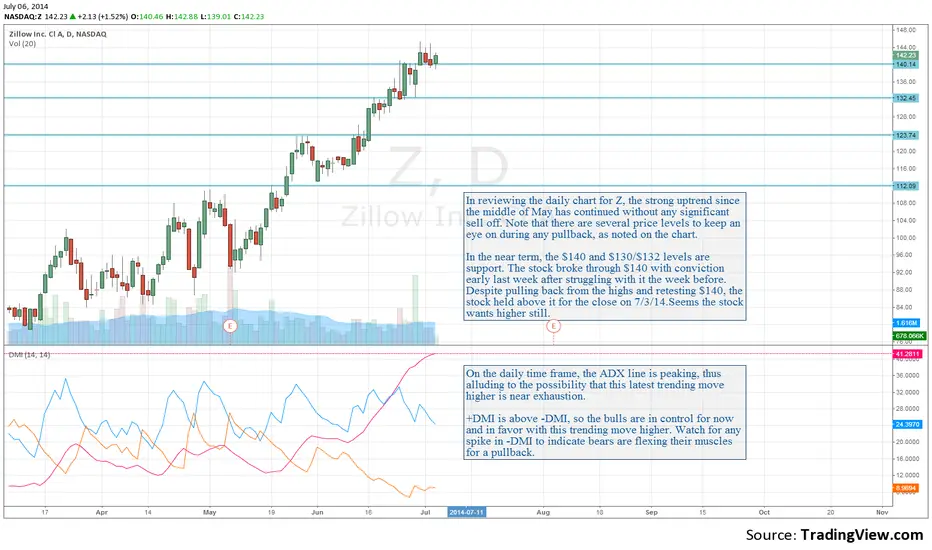
In reviewing the daily chart for Z, the strong uptrend since the middle of May has continued without any significant sell off. Note that there are several price levels to keep an eye on during any pullback, as noted on the chart.
In the near term, the $140 and $130/$132 levels are support. The stock broke through $140 with conviction early last week after struggling with it the week before. Despite pulling back from the highs and retesting $140, the stock held above it for the close on 7/3/14.Seems the stock wants higher still.
Blog post dated 07/05/2014: syncubate.com/blog/2014/7/6/zillow-trending-move-analysis
In the near term, the $140 and $130/$132 levels are support. The stock broke through $140 with conviction early last week after struggling with it the week before. Despite pulling back from the highs and retesting $140, the stock held above it for the close on 7/3/14.Seems the stock wants higher still.
Blog post dated 07/05/2014: syncubate.com/blog/2014/7/6/zillow-trending-move-analysis

Clause de non-responsabilité
Les informations et publications ne sont pas destinées à être, et ne constituent pas, des conseils ou recommandations financiers, d'investissement, de trading ou autres fournis ou approuvés par TradingView. Pour en savoir plus, consultez les Conditions d'utilisation.
Clause de non-responsabilité
Les informations et publications ne sont pas destinées à être, et ne constituent pas, des conseils ou recommandations financiers, d'investissement, de trading ou autres fournis ou approuvés par TradingView. Pour en savoir plus, consultez les Conditions d'utilisation.