
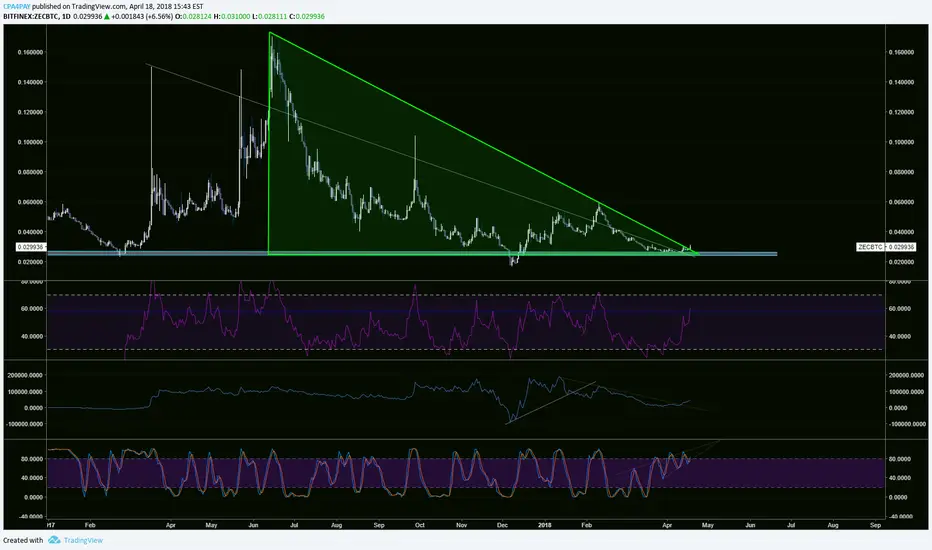
ZEC appears to be breaking through this huge descending triangle.
Everytime RSI has gone over about 58 (see historical blue line), the price has exploded. Right now its peaking above it on the daily chart.
I dont see whats not to like here.
Everytime RSI has gone over about 58 (see historical blue line), the price has exploded. Right now its peaking above it on the daily chart.
I dont see whats not to like here.

Clause de non-responsabilité
Les informations et publications ne sont pas destinées à être, et ne constituent pas, des conseils ou recommandations financiers, d'investissement, de trading ou autres fournis ou approuvés par TradingView. Pour en savoir plus, consultez les Conditions d'utilisation.
Clause de non-responsabilité
Les informations et publications ne sont pas destinées à être, et ne constituent pas, des conseils ou recommandations financiers, d'investissement, de trading ou autres fournis ou approuvés par TradingView. Pour en savoir plus, consultez les Conditions d'utilisation.