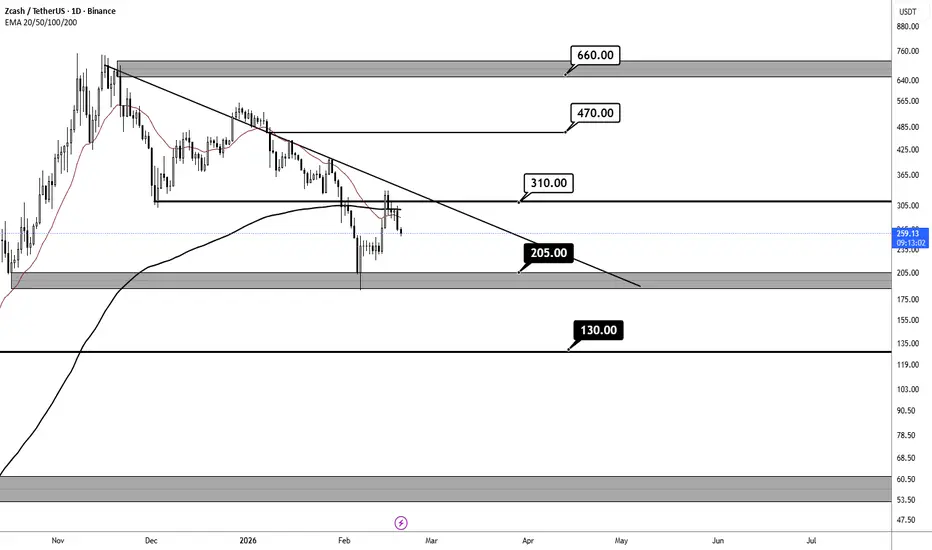
For the bullish trend to continue 
 ZECUSDT, the price needs to break above 310.00 and, at the same time, the descending trendline must be broken 📈. This could signal a shift in the market towards an upward trend 🚀. On the other hand, for the bearish trend to persist, the price must fall below 205.00 , and the 200-period EMA should confirm that the trend remains bearish 📉. These two factors could increase selling pressure and push the price towards lower levels.
Support levels:
Resistance levels:
ZEC
ZECUSDT, the price needs to break above 310.00 and, at the same time, the descending trendline must be broken 📈. This could signal a shift in the market towards an upward trend 🚀. On the other hand, for the bearish trend to persist, the price must fall below 205.00 , and the 200-period EMA should confirm that the trend remains bearish 📉. These two factors could increase selling pressure and push the price towards lower levels.Support levels:
- 258.07 USD: Current short-term support 🛑
- 205.00 USD: Stronger support if the downtrend continues 🔻
- 130.00 USD: Final support if previous levels are broken ⚠️
Resistance levels:
- 310.00 USD: Resistance near the previous high ⬆️
- 470.00 USD: Next resistance if the price rises 💪
- 660.00 USD: Long-term resistance if the trend reverses 🌟
ZECTransaction en cours
Breakout 310$ is the best action for 2th pump.Trade fermée: cible de profit atteinte
Note
470Note
660 is strong level on resistance ...
Publications connexes
Clause de non-responsabilité
Les informations et publications ne sont pas destinées à être, et ne constituent pas, des conseils ou recommandations financiers, d'investissement, de trading ou autres fournis ou approuvés par TradingView. Pour en savoir plus, consultez les Conditions d'utilisation.